Unity Log Viewer - In-Game Logs for Mobile Debugging
On physical devices, Unity's console is editor-only — logs go to ADB Logcat or Xcode Console, both of which require a cable and a desktop machine.
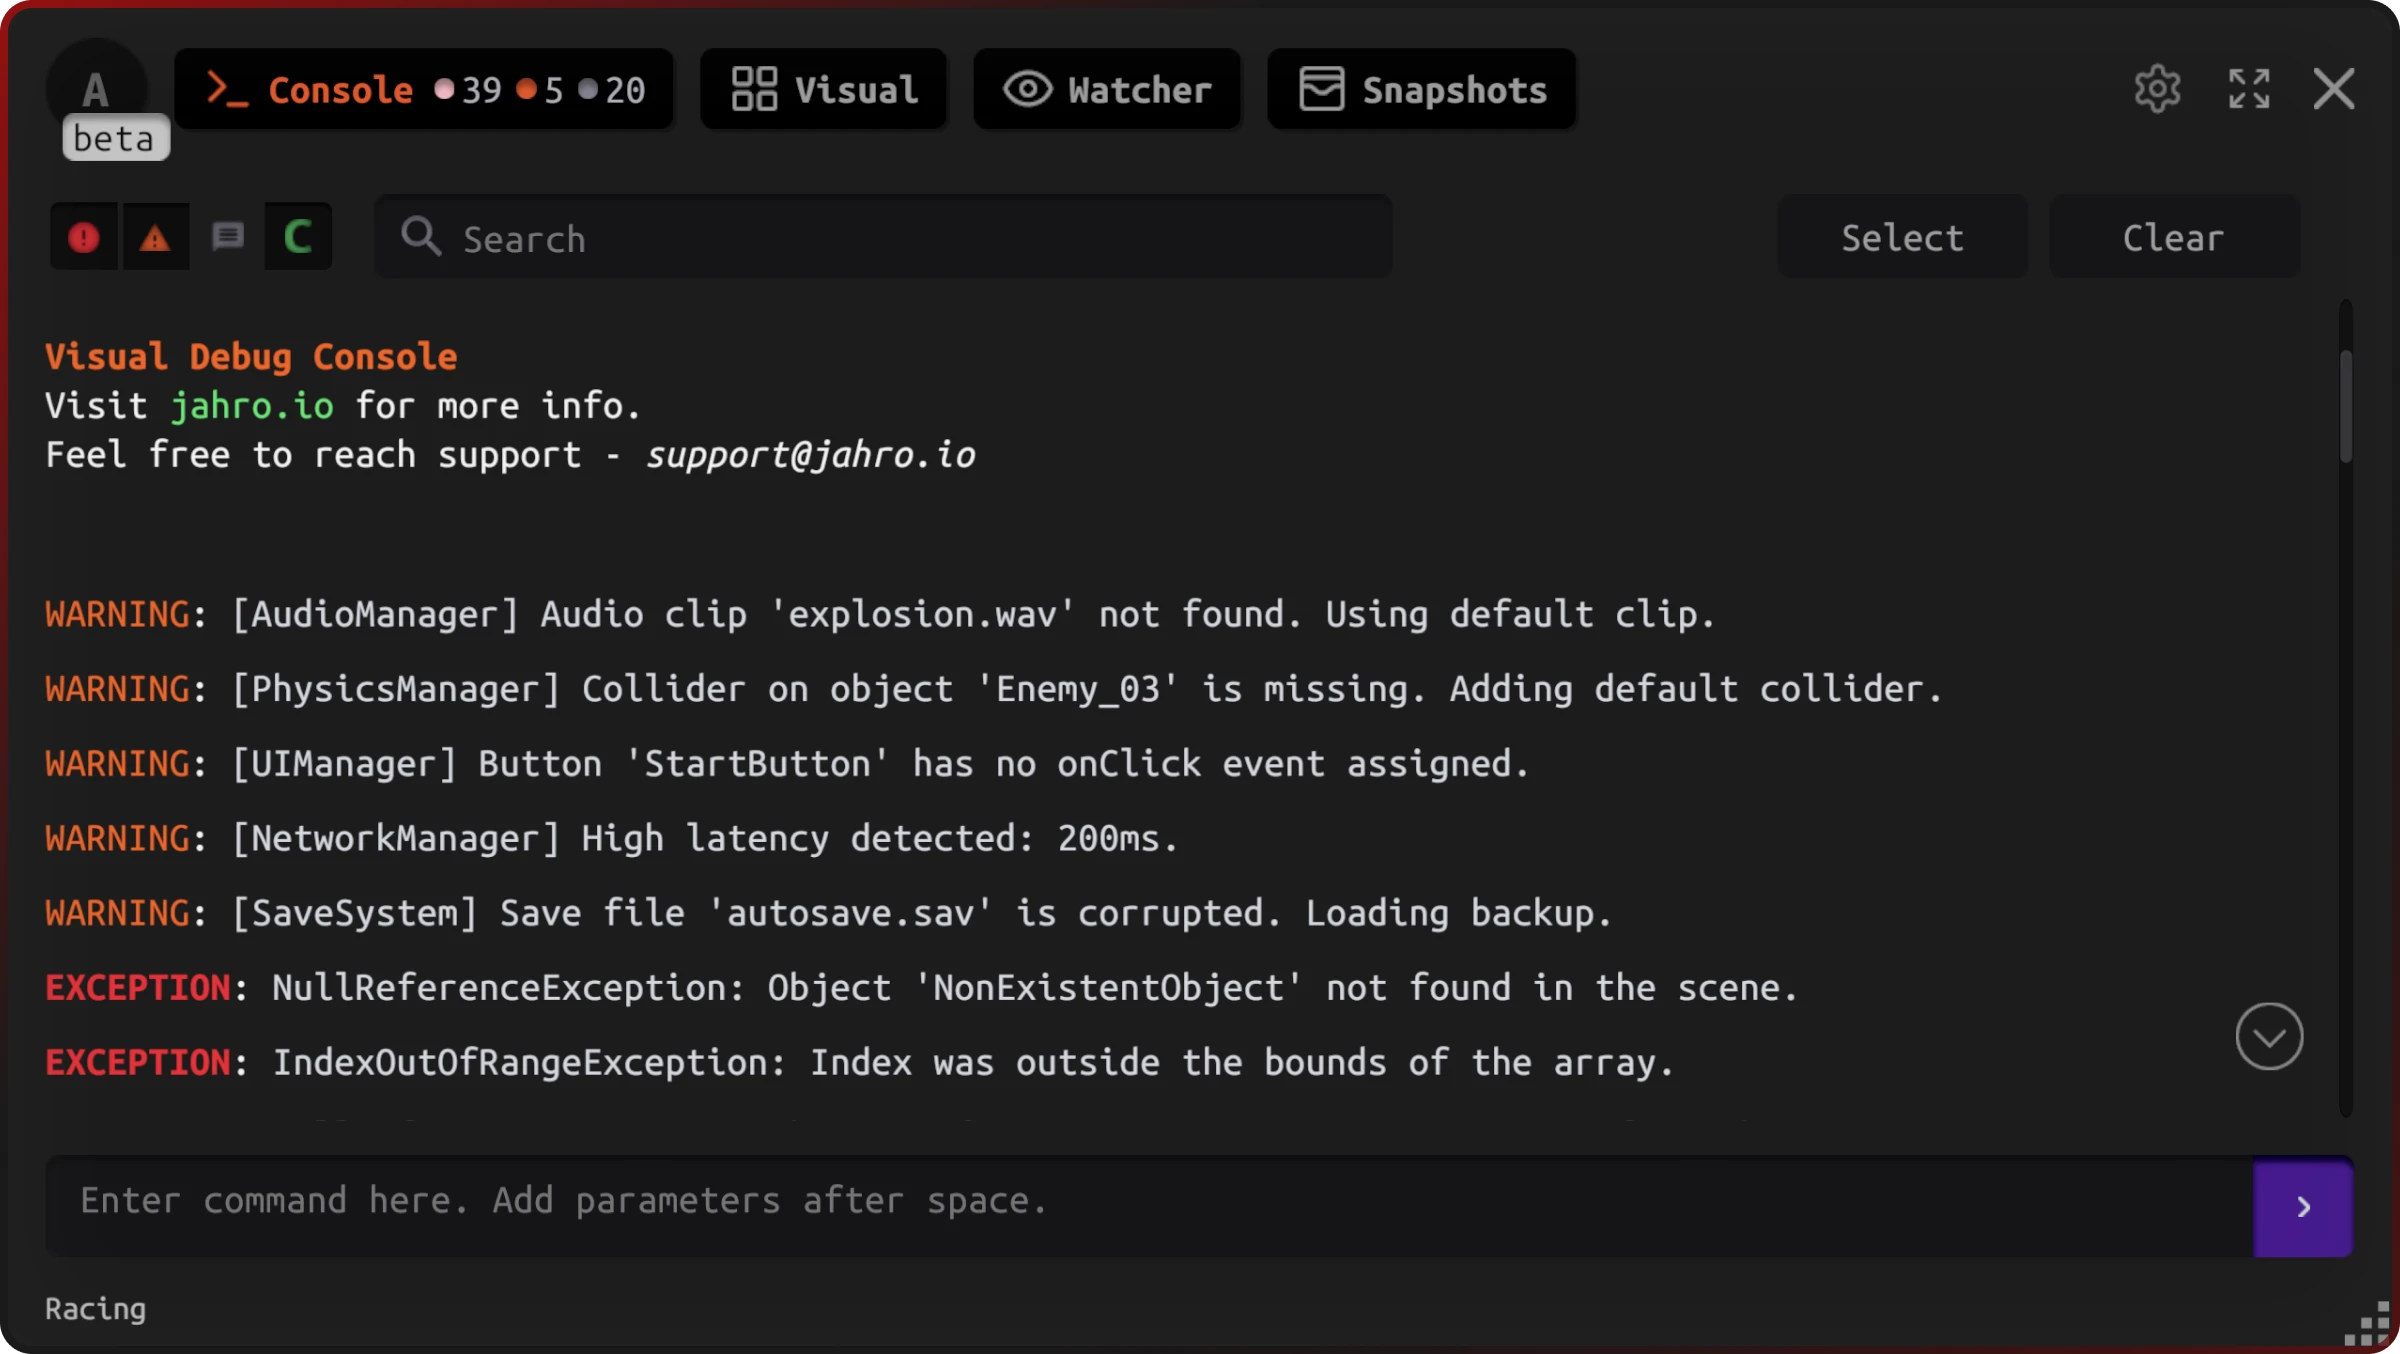
Jahro adds an in-game log viewer that runs directly on the device. It hooks into Unity's logging system at startup, so every Debug.Log, warning, and error appears in-game without any external tooling. Output from Commands shows up in the same interface.
Opening the log viewer
Press ~ to open the Jahro console in your build. All Unity log output is available immediately.
Log types
The console captures four types of output:
| Type | Source |
|---|---|
| Error | Debug.LogError() and unhandled exceptions |
| Warning | Debug.LogWarning() |
| Log | Debug.Log() |
| Command | Return values from [JahroCommand] methods |
Toggle each type using the filter buttons in the console header. Filters combine freely — enable any subset.
Search
The search field filters across all log types in real time. Search is case-insensitive.
Command output
When a [JahroCommand] method returns a string, the console prints it automatically. Use this to query game state without adding temporary Debug.Log calls:
[JahroCommand]
public static string GetPlayerPosition()
{
    return $"Player Position: {Player.Instance.transform.position}";
}
Running this command from the console prints the result directly to the log viewer. See Commands for the full [JahroCommand] API.
Sharing logs with your team
The in-game viewer shows the current session only. To share logs or review them later, sync a Snapshot to the Jahro Web Console, which bundles your logs, screenshots, and device metadata into a shareable link.
See Snapshots for how capturing and sharing works.
Edge cases
High log volume — The viewer handles large log counts, but a tight per-frame loop that logs every frame will make scrolling sluggish. Use type filters to reduce displayed output, or add a guard in your logging code.
Logs from background threads — Jahro captures log calls from all Unity threads. Logs from non-main threads are queued and displayed on the main thread in the order they arrive.
Custom Application.logMessageReceived handlers — Jahro registers its own handler alongside any existing handlers in your project. It does not replace or suppress yours.
AI-assisted logging
The logging agent skill teaches your AI coding assistant to review and improve Debug.Log usage — restructuring scattered log calls into a consistent [Tag] Action — key=value format with criticality tiers and boundary-based placement. Works on any Unity project, with or without Jahro.
Tell your AI: "Review the logging in my SaveManager" and it detects antipatterns, classifies system criticality, and generates structured logs.
Frequently Asked Questions
How do I view Unity logs on Android without ADB?
Install Jahro via Unity Package Manager, then press ~ to open the in-game console in your Android build. All Debug.Log output, warnings, and errors appear immediately. No cable or ADB required.
How do I view Unity logs on iOS without Xcode?
With Jahro installed, press ~ to open the in-game console on your iOS device. You get only your Unity logs, with filter controls and search. No Mac or Xcode required.
Can I share Unity device logs with my QA team? Yes. Use Snapshots to bundle logs, screenshots, and device metadata into a shareable link. QA captures the context in one tap; you get the full session via a web link.
Why can't I see Unity Debug.Log on my phone? Unity's built-in console only runs in the Editor. On device, logs go to Android Logcat or iOS Console — both require cables and desktop tools. Jahro adds a log viewer that runs inside the game on the device itself.
Is Jahro's log viewer better than ADB Logcat for Unity? For Unity-specific debugging, yes. Logcat shows output from all system processes; Jahro shows only your Unity logs. Jahro also filters by type, supports search, and lets you share logs from the device, no desktop needed.