The state of Unity mobile debugging: 2026 industry report
Unity mobile debugging is the work of pulling reliable signals from real iOS and Android builds: logs, crashes, device facts, and enough context to reproduce. Teams are smaller and more spread out than five years ago, and shipping still has to clear a higher bar. This report pulls public stats, papers, and documented tool tradeoffs together so you can reason about your stack without living in vendor slide decks.
If you are short on time, read the executive summary, the tool comparison table, and What poor launch quality costs first.
Mobile Unity is huge. Default tooling still assumes one developer, one cable, one machine.
Executive summary — five numbers that frame the problem
- ~5 million Unity engine users (Unity gaming report).
- ~71% of the top 1,000 mobile games use Unity (industry summaries such as worldmetrics.org); ~90% of surveyed developers’ most recent titles launched on mobile (2025 Unity Gaming Report launch).
- 35–50% of software engineering time commonly goes to validation and debugging (Microsoft Research TSE19 preprint; ACM Queue); Coralogix cites up to 75% for complex systems (analysis).
- 68% of game companies adopted remote or hybrid work in 2023 (ZipDo’s 2025 compilation — directional). Day 30 mobile game retention is about 5% (Business of Apps) — a buggy launch hits an already thin funnel.
- Fixing a defect in production often costs on the order of 100× more than in design — IBM phase framing, widely cited via software-quality economics (CISQ).
Methodology (short): Public sources only: Unity reports, Sensor Tower, Business of Apps, GDC summaries, CISQ/Luciq, ASE/ScienceDirect papers, Asset Store/GitHub, Apple/Google docs. Jahro claims were checked against jahro.io (April 2026). Studies that isolate “% time debugging” for Unity specifically are thin; the 35–50% band comes from general software engineering literature. Treat ZipDo-style compilations as directional, not something you’d take to the board without your own numbers.
Those five figures are the frame: scale, how much time disappears into debugging, distributed teams, retention math, and how fast cost rises when bugs slip late. The rest of the report sits on top of that.
The scale of Unity mobile development
Unity is not a niche pick for mobile. It is default infrastructure for a large slice of the store. Unity reports about five million engine users (2026 report). Industry commentary cites roughly half of mobile games using Unity, and about 71% of the top 1,000 mobile games (Unity data via aggregators such as worldmetrics.org). 5 billion monthly downloads hit apps built with Unity, and global mobile game revenue was on the order of $92 billion in 2024 (~49% of gaming revenue) per Sensor Tower State of Mobile Gaming 2024.
In Unity’s developer surveys, 90% of respondents’ most recent games shipped on mobile (2025 Unity Gaming Report — launch coverage); desktop and console follow. Multi-platform scope is growing: developers targeting three or more platforms rose 34% year-over-year in 2024.
Mobile is the dominant Unity target. New release volume is down (126k vs 222k year-over-year per Sensor Tower–style industry summaries) while the quality bar keeps rising.
Team size, layoffs, and outsourced QA
The median team is not a AAA floor. Surveys in the 45–55% range report solo indie developers; ~70% of indie teams have under 10 people (industry survey summaries via sources such as gitnux.org indie statistics). Unity’s 2026 report notes smaller teams shipping smaller scope — 52% focusing on more manageable projects, and efficiency tools as a primary risk strategy for 45% of surveyed developers (2025 Unity report).
The GDC 2026 State of the Game Industry (GDC) reflects a rough employment cycle: 28% of developers reported layoffs in the past two years (press summaries such as Business Wire). Lean teams mean fewer dedicated QA staff, more outsourced testing, and more pressure on any tool that shortens the bug loop.
The game QA outsourcing market was valued around $1.5B in 2024 with high single-digit CAGR through the early 2030s in industry reports (market.us and related); mobile accounts for a large fraction of testing demand. External testers rarely have your ADB setup or a Mac for every iOS build.
Debugging often falls to the same people shipping features. External QA needs evidence that travels without a cable.
The debugging tool landscape — six categories
There is no single stack. Teams stitch together platform tools, in-game overlays, crash analytics, custom consoles, Editor tooling, and increasingly cloud-backed workflows. For a feature-level map with neutral framing, see Unity debugging tools compared (2026).
Platform-native CLI and GUI tools — ADB logcat on Android streams device logs to a workstation; Xcode Instruments / Console on macOS does the analogous job for iOS. Strength: always there, no license. Weakness: USB or same-network setup, a developer-centric workflow, noisy streams, and no built-in share to a ticket. A Windows developer cannot run Xcode. That is a real constraint for cross-platform Unity shops.
On-device overlays — SRDebugger (commercial, one-time purchase on the Asset Store) and Lunar Console (open source) show Debug.Log in-app. Strength: immediate visibility on the device in hand. Weakness: no remote session by default; QA in another city cannot hand you the console without screenshots or screen recording. SRDebugger brings options/cheats and active maintenance as of 2026; Lunar’s free tier is read-oriented — check GitHub for your Unity version.
Post-crash analytics — Firebase Crashlytics is the common default. Strength: fleet-wide crash grouping and trends. Weakness: post-mortem — it will not answer “what was QA doing for two minutes before the soft-lock?” for every session.
Custom consoles — Studios build internal overlays when they need security, bespoke workflows, or legacy inertia. Cost is engineering + maintenance every Unity upgrade.
Unity Editor — Profiler, Console, Frame Debugger: excellent for Editor and development builds, not for TestFlight or internal APK flows where QA uses standalone builds.
Cloud-based remote debugging — Products that stream session data to a browser address distance and handoff. This category is still small relative to ADB usage.
Where things land in practice: SRDebugger wins on one-time price for solo devs who only need an on-device panel. Crashlytics wins on fleet crash analytics. ADB wins on depth when you already have the device and a terminal. Cloud consoles compete on async evidence and team visibility, not on replacing every pixel of Instruments.
Match category to question — live session vs crash aggregate vs Editor performance vs distributed evidence.
The tool comparison table
| Tool | Price | Architecture | Remote access | Team features | Commands | Active maintenance | Mobile platforms |
|---|---|---|---|---|---|---|---|
| ADB Logcat | Free | USB/WiFi, device-local | No (USB / LAN) | No | No | N/A (OS tool) | Android only |
| Xcode Instruments | Free | USB/WiFi, Mac required | No | No | No | N/A (Apple tool) | iOS only |
| SRDebugger | $30 one-time | On-device only | No | No | Yes (on-device) | Yes (updated 2026) | iOS + Android |
| Lunar Console | Free | On-device only | No | No | No (free version) | Limited / community | iOS + Android |
| Firebase Crashlytics | Free | Post-crash, cloud | Yes (dashboard) | Limited | No | Yes (Google) | iOS + Android |
| Unity Editor | Free (with Unity) | Editor / dev build | No | No | No | Yes | All (dev only) |
| Custom console | Dev cost | On-device (typical) | Variable | Variable | Variable | Internal only | Variable |
| Jahro | Free Solo; Team on request | Cloud SaaS | Yes (browser) | Yes (RBAC) | Yes (in-game + web) | Yes (active SaaS) | iOS + Android + Editor |
Remote, real-time, cross-platform team access is still uncommon in the free tier of the ecosystem — most zero-cost stacks stay local to the device.
What the landscape still does not solve
Four gaps show up repeatedly in production postmortems and support threads:
- QA handoff — Few free tools give a remote tester a single action that packages logs + device + screenshot + build for a developer.
- iOS on Windows — Without a Mac or a cloud intermediary, iOS logs stay behind a platform wall.
- Async coordination — On-device overlays do not fix timezone and Slack latency; they only display text on hardware.
- Session context — Crash tools report failure; they do not always preserve minutes of ordered log context before a non-fatal defect.
Fragmentation (ASE ’16 documents driver-level variance) plus incomplete reports (ScienceDirect 2024 on web-app bug reports) means “cannot reproduce” is often missing information, not laziness.
The debugging tax — time, defects, and phase cost
Software engineering research repeatedly lands on 35–50% of time in debugging and validation (see Microsoft preprint and ACM Queue above). Coralogix pushes that to 75% for complex systems — treat it as a worst-case stress, not a law of nature.
Industry averages also cite on the order of 70 defects per 1,000 lines of code and 30× longer to fix than to write a line (Coralogix / software economics summaries). A mid-size Unity codebase can imply thousands of latent issues before QA starts — another reason to catch early.
IBM phase multipliers (design 1×, testing 15×, production 100×) remain the standard teaching frame. CISQ estimated $2.41 trillion in US poor-quality software cost (2022 report) — not games-only; use as macro context.
If you do not measure debugging time, you undercount it. It hides inside tickets and “investigation” buckets.
Remote work and the QA loop
ZipDo’s 2025 compilation ties remote game work to longer timelines (66%), timezone pain (47%), and async strain (61%) — reproduction is serial, so coordination tax hits debugging hardest. The usual loop: ticket → screenshot → ask for logs → QA re-runs → photos of console text → wrong device → cannot reproduce. jahro.io quotes cite ~15 minutes to pull logs manually vs seconds with capture — anecdotal, consistent with USB overhead.
Without structured artifacts, distributed QA taxes every sprint.
What poor launch quality costs
Stability benchmarks from industry analyses (for example Luciq Mobile App Stability Outlook 2025 and Business of Apps performance data) tie crash-free sessions to star ratings. Falling below ~99.7% crash-free sessions correlates with sub-3-star territory in those models; Google Play-style visibility risk appears when user-perceived crash rates exceed roughly 1%.
Retention already drops fast: ~28% day 1, ~13% day 7, ~5% day 30 for mobile games (Business of Apps retention). A bad launch burns the narrow window you had.
Stability is not just technical — it feeds discoverability and revenue.
Developer sentiment — forums and switching signals
Unity forums include SRDebugger “alternatives” threads when update cadence worries appear; Lunar Console GitHub issues still request remote logs and commands — both consistent with on-device ceilings. A 2024 tools survey (debugg.ai) found over 70% of developers relying on Logcat as a primary Android feedback path — default, not beloved.
Published jahro.io testimonials (attributed on site): "used to take me ~15 min to pull logs… snapshot is my new best friend." (MINORUEATSLEGS); "not a fan of logcat and adb… switched to Jahro." (Ivan, QA); "internal playtests with the publisher… we watch everything from our end." (PHIST, CTO).
The pain point is handoff-quality evidence, not raw log volume.
Where cloud based tooling fits — Jahro without the pitch deck
Jahro streams Unity session data to a GDPR-oriented EU backend; console.jahro.io shows logs and captures in a browser. Solo is free (member/project/snapshot limits); Team is on request. Unity 2021.3 LTS+. Crashlytics remains complementary for fleet crashes.
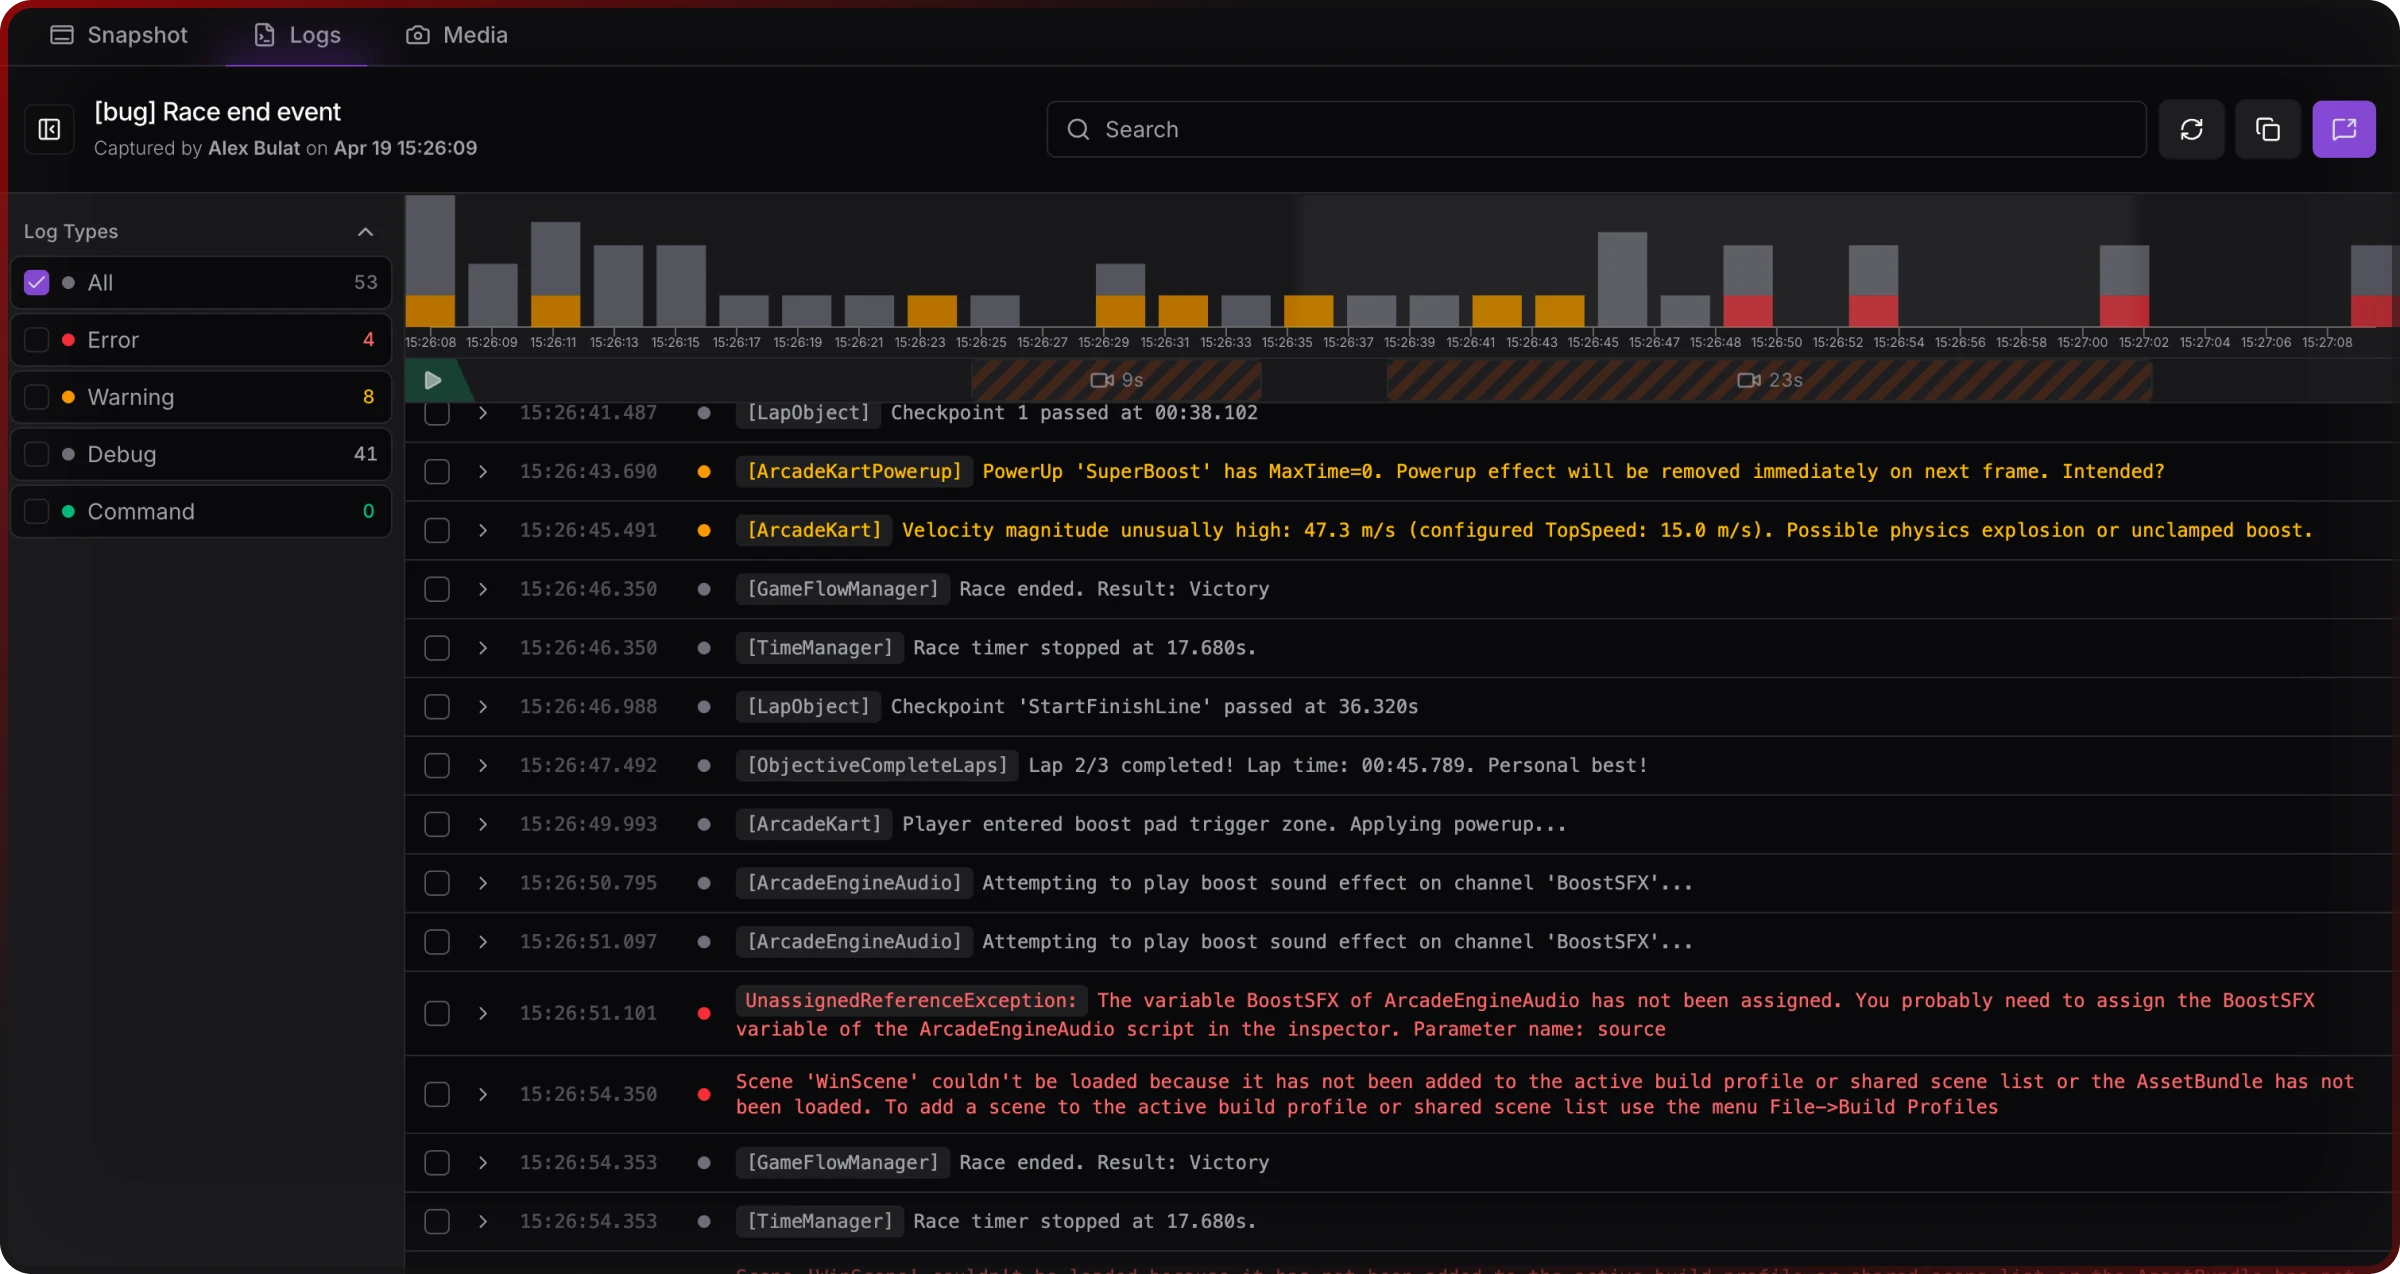
The web logs viewer — filtered rows, search, Share — is the remote read path ADB does not give someone without the device.
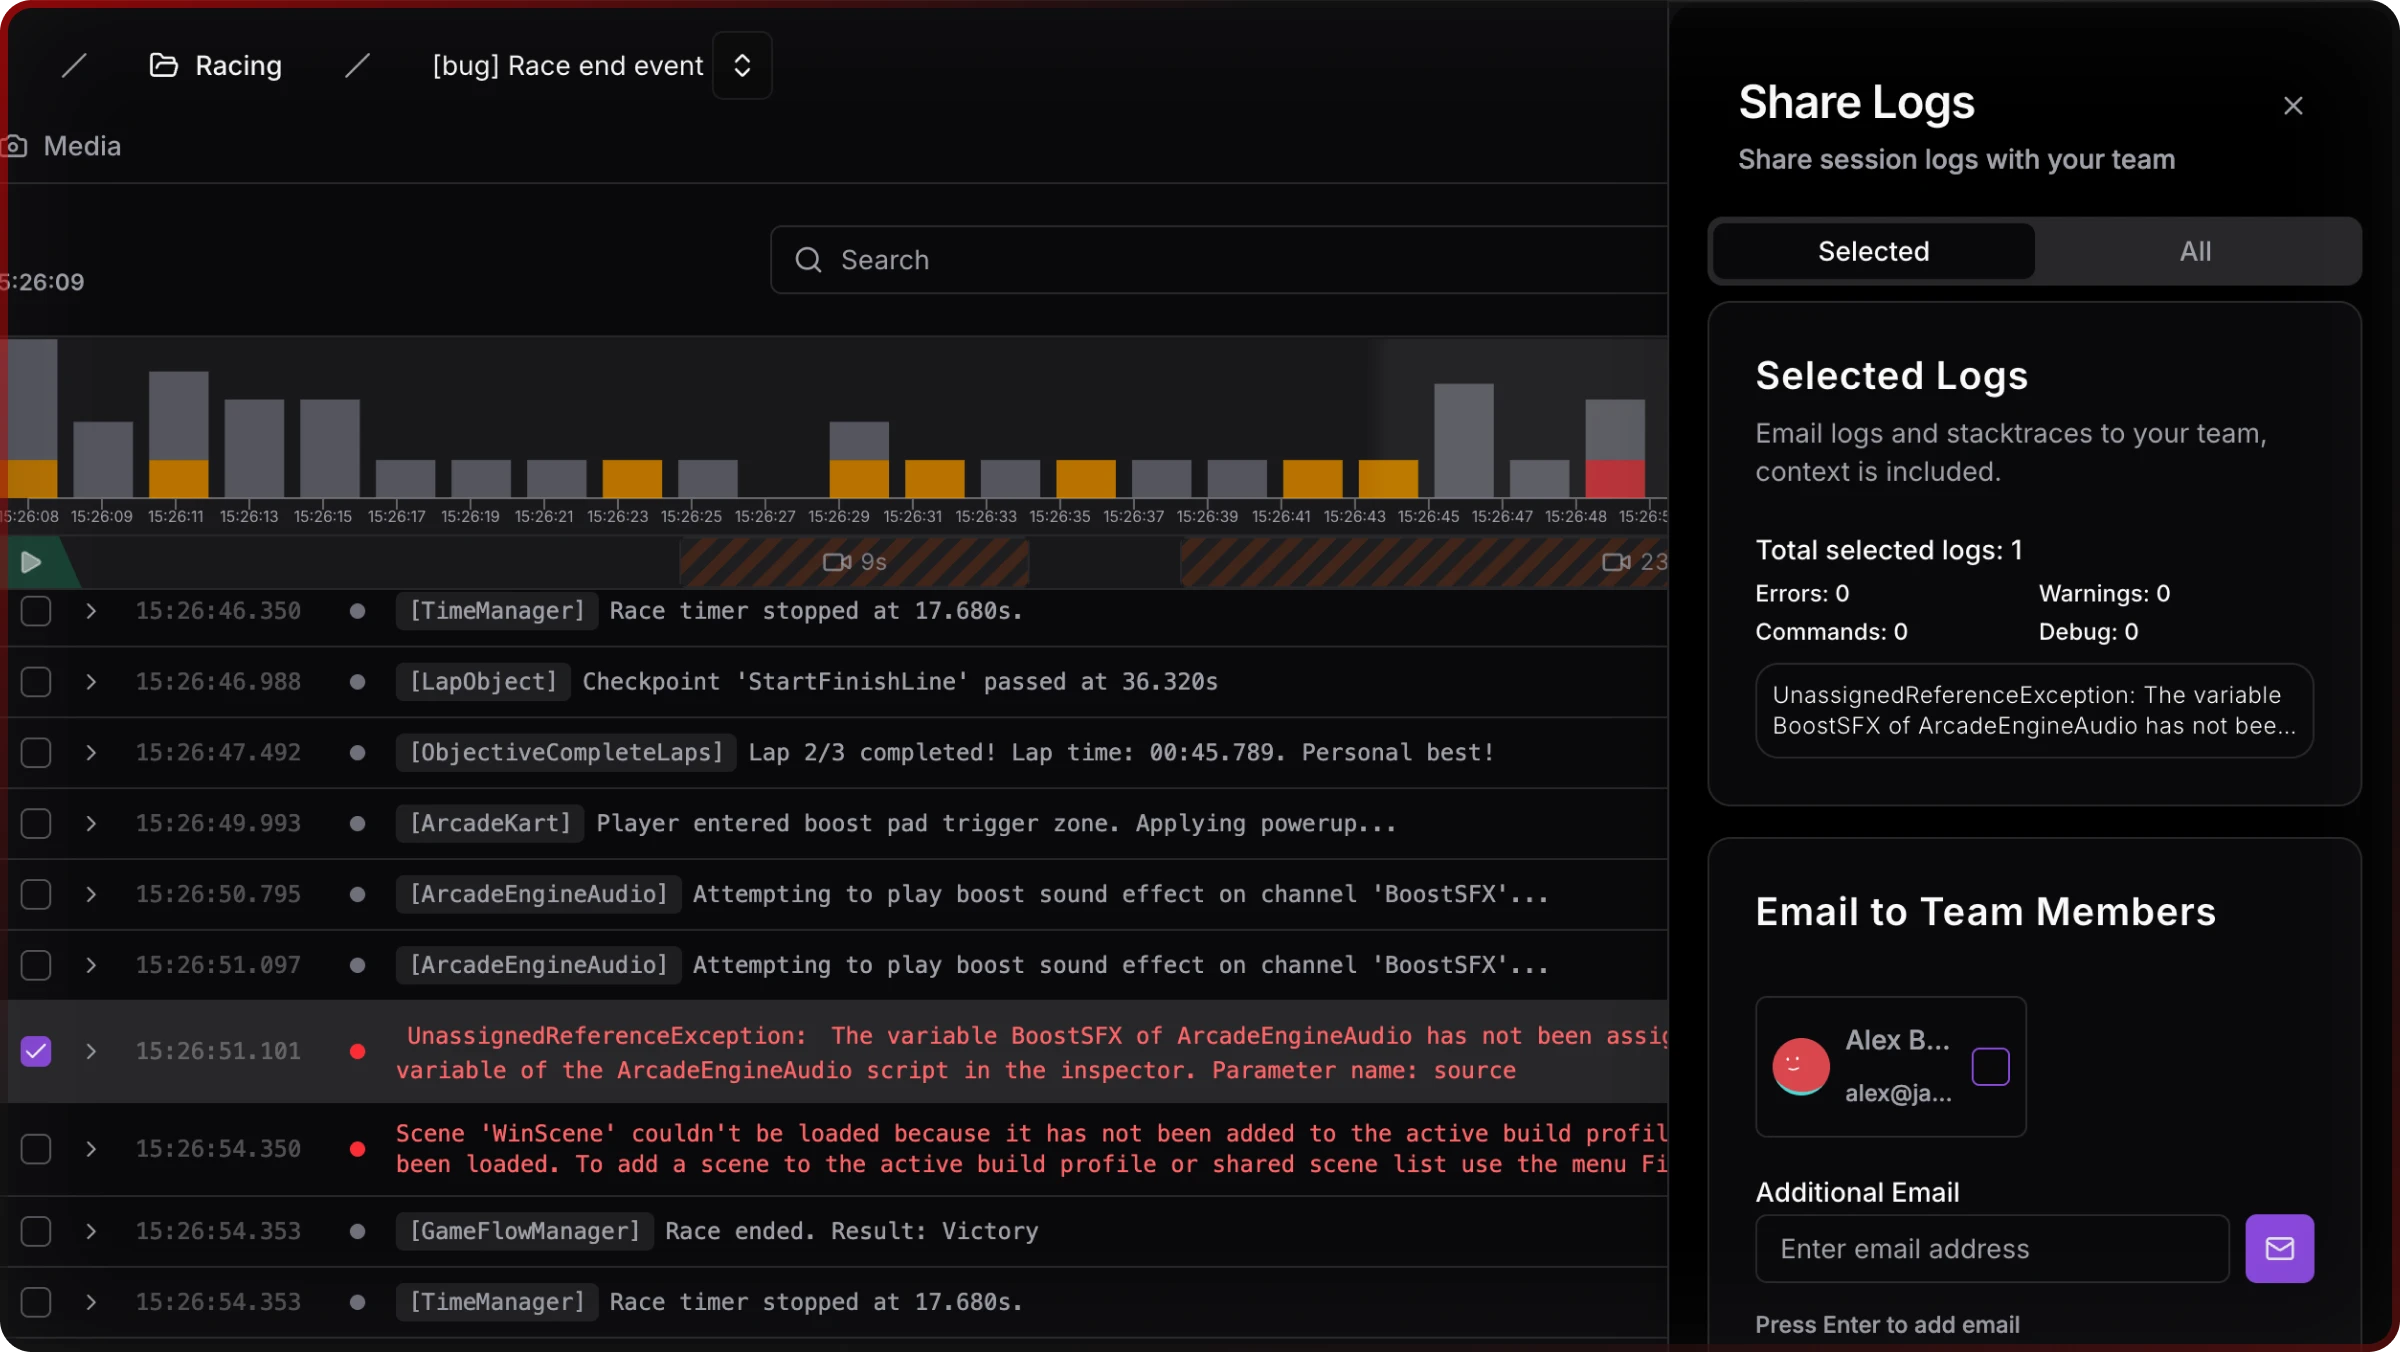
Share Logs — session URL plus optional email to teammates — supports async handoff without pasting from a terminal.
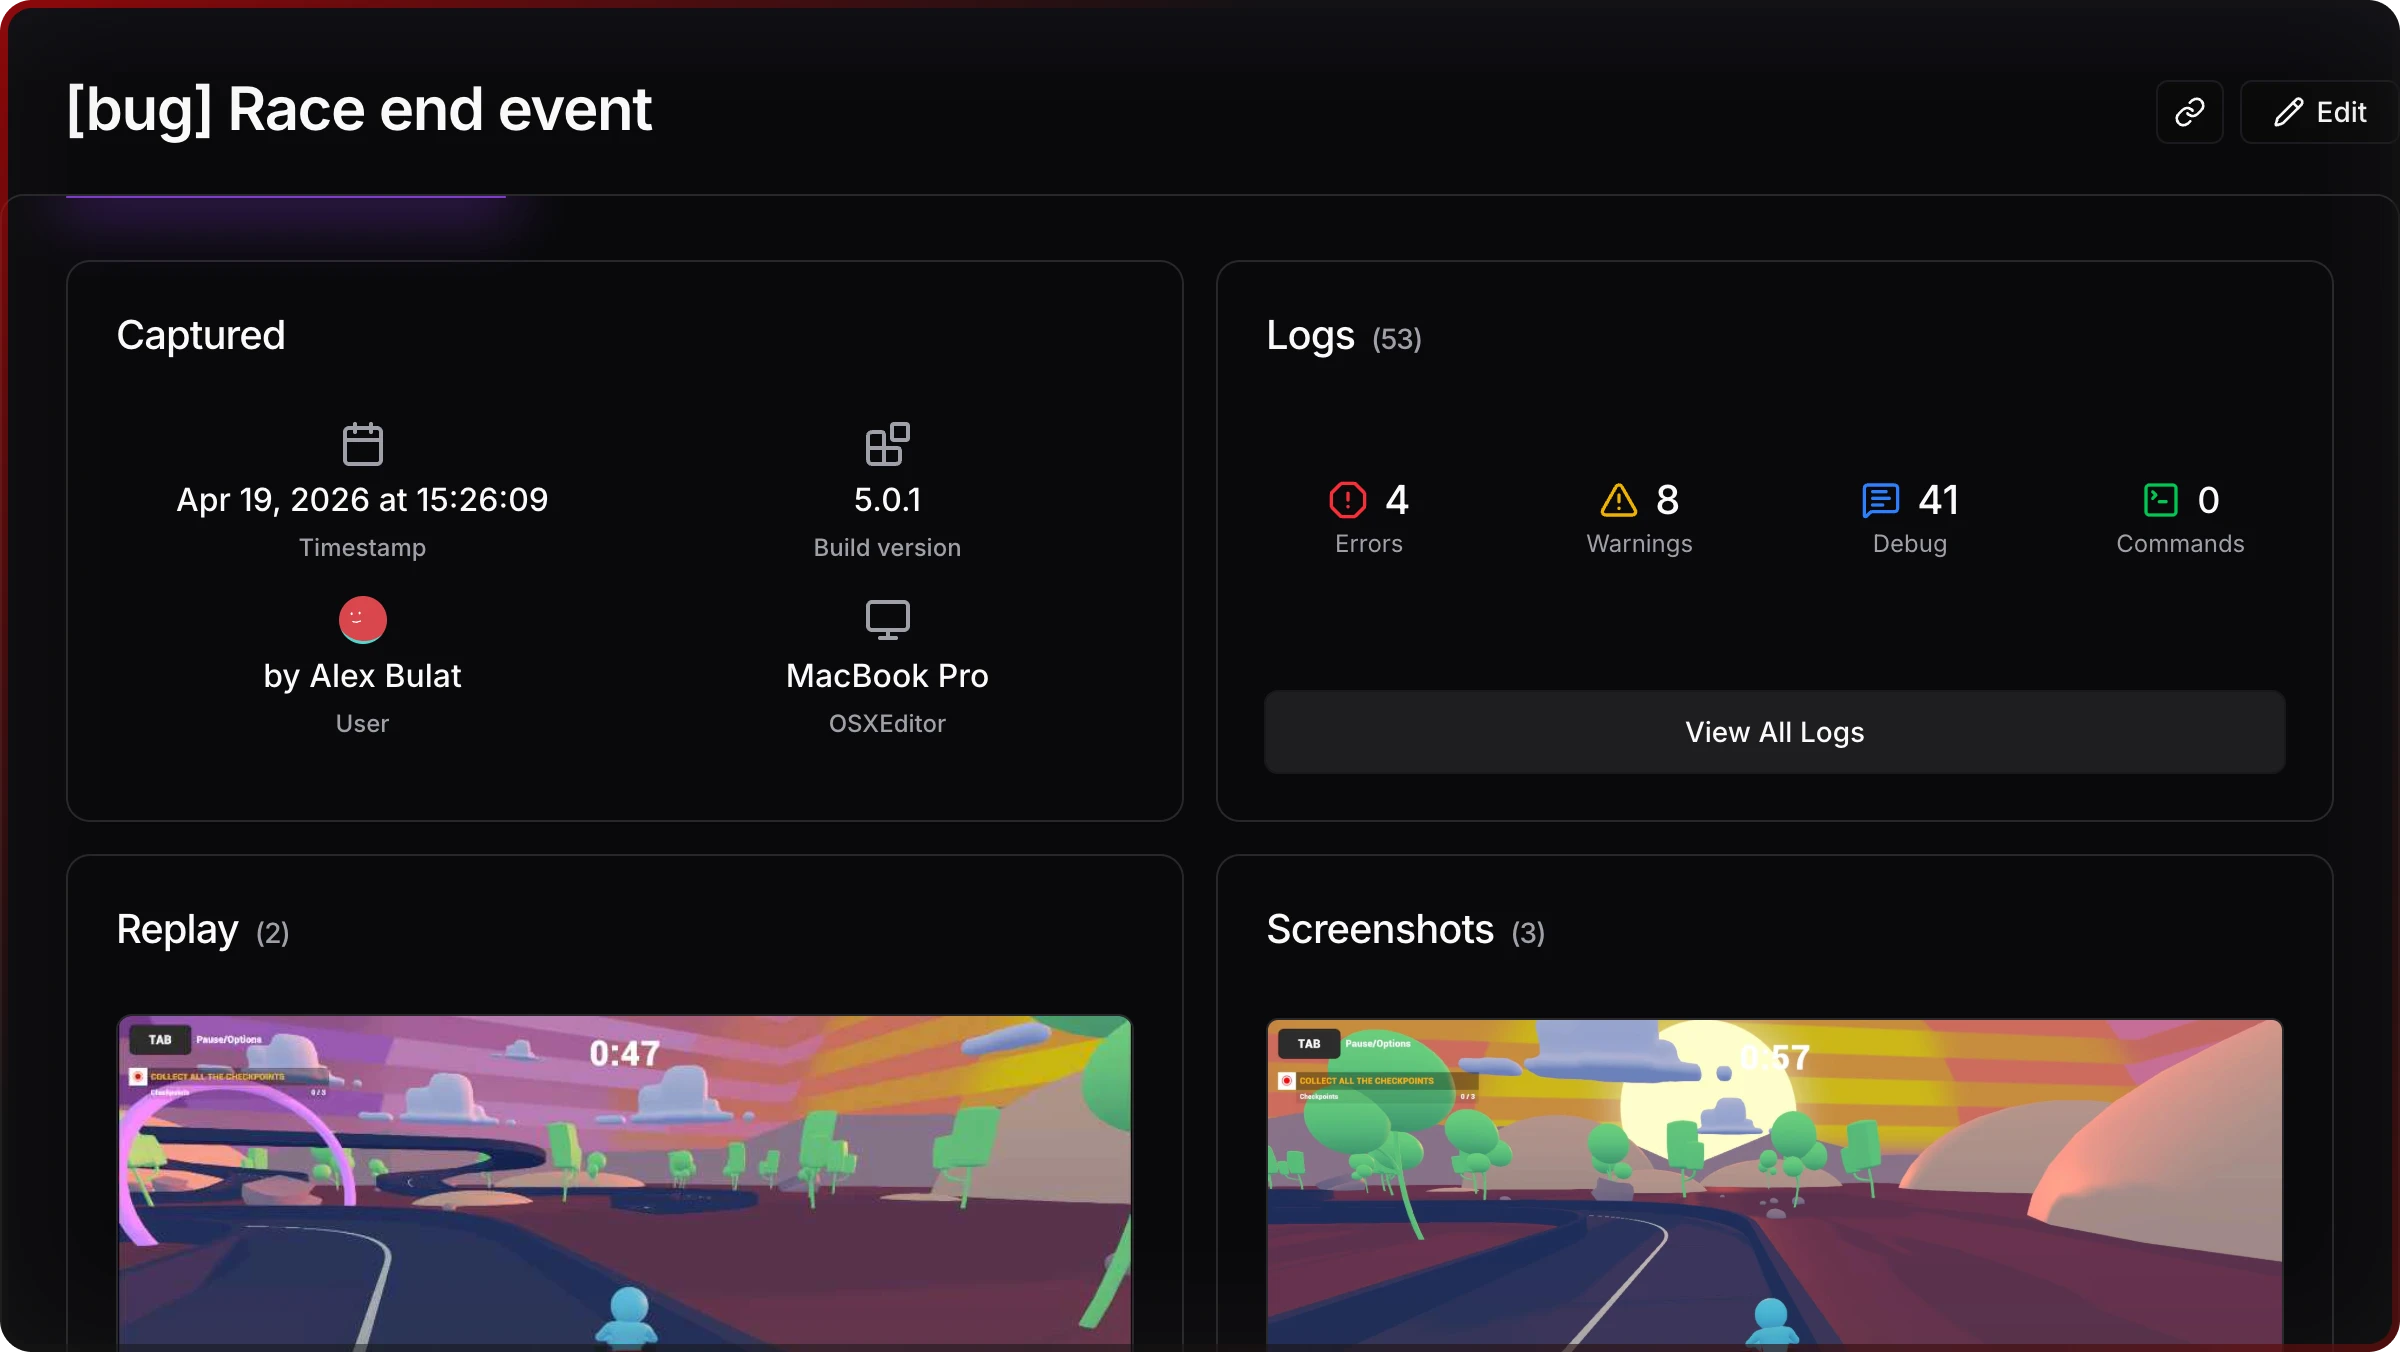
Snapshots attach logs, screenshots, and metadata (device, build, time) to one link — addressing the session context gap post-crash analytics do not always cover.
Use Crashlytics + on-device consoles + cloud handoff where each fits; they answer different questions.
Predictions for 2026 and beyond
Lean teams will drop redundant panels. Fragmentation stays painful (Android drivers; Unity 6 rendering paths). Publishers will want audit-style repro artifacts, not chat screenshots. AI adoption is already widespread (96% of studios use AI in some workflow, Unity 2026) — structured session exports beat opaque on-device-only streams for teams that need to share proof.
Pressure moves toward shareable, early evidence — not louder raw logs.
Limitations and refresh
ZipDo-style figures are industry compilations — hedge for commitments. Unity-only debugging-time % is under-measured in peer work. Jahro Team pricing is contact; SRDebugger unit sales are not public. Treat this as an April 2026 snapshot.
About Jahro: Cloud-backed Unity mobile debugging — Package Manager SDK, console.jahro.io. Neutral tool matrix: Unity debugging tools compared (2026); setup: Getting started.
FAQ
How many Unity developers are there in 2026?
On the order of five million engine users per Unity’s 2026 report — use as ecosystem scale, not a daily-active census.
What percentage of mobile games use Unity?
Unity claims more than half; top-1000 lists often cite about 71% — methodology varies by store and genre.
What debugging tools do Unity developers use?
ADB, Xcode, in-game consoles (SRDebugger, Lunar Console, and others), Firebase Crashlytics, Unity Editor profilers, sometimes custom tools — rarely one alone.
How much time do developers spend debugging?
General software engineering literature often cites 35–50%; Coralogix cites higher for complex systems. Measure your own team if you can — aggregates hide studio-specific truth.
Is Firebase Crashlytics enough for QA?
No — it is built for post-crash fleet analytics. Pre-release iteration needs live signals and reproduction context; most teams pair Crashlytics with a session or console workflow.
How does Jahro relate to SRDebugger or Lunar Console?
SRDebugger and Lunar Console excel at on-device viewing for whoever holds the hardware. Jahro targets browser-visible sessions and shareable captures — a different job. Some teams use both.