Web Console — Unity Team Debugging Hub
When a bug only happens on a QA tester's device, the web console is where you go to read the full story.
Snapshots captured inside Unity land here automatically — logs, screenshots, and device context together in one place. You can filter by log type, search across all messages, expand stacktraces, and share a link to a specific session or error without attaching files or switching tools. Team members see exactly the same data regardless of what device captured it.
How the console is organized
The web console uses a four-level hierarchy:
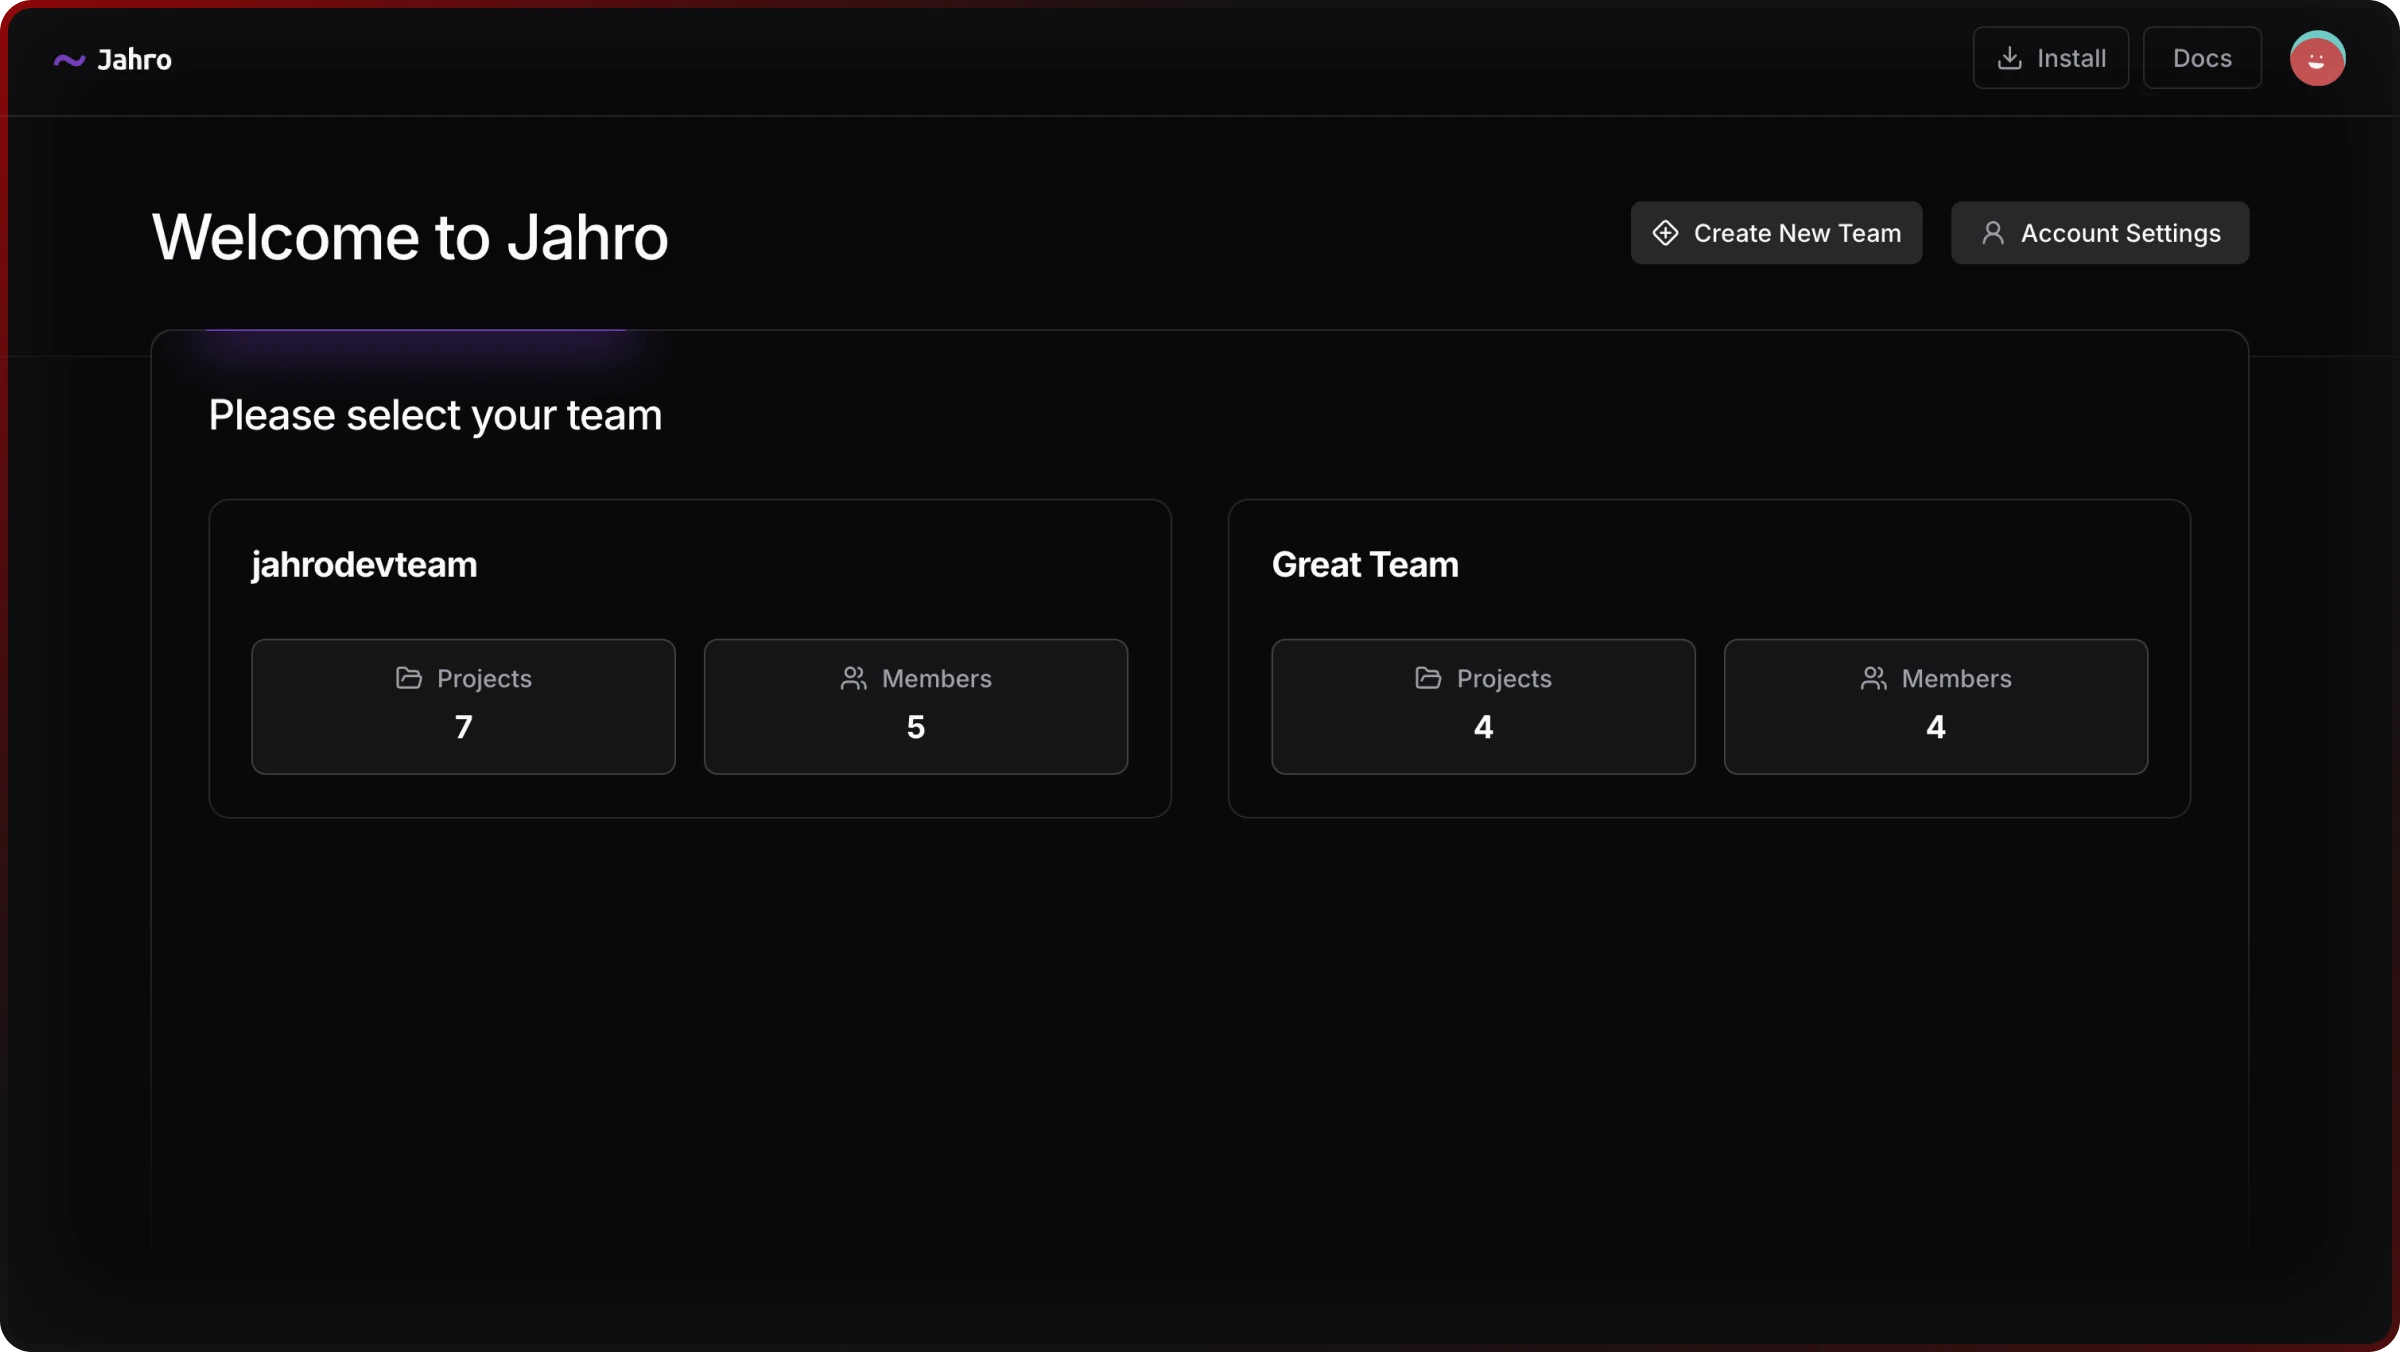
Team → Project → Snapshot → Logs / Screenshots
| Level | What you find there |
|---|---|
| Team dashboard | All projects and team members |
| Project dashboard | API keys, project settings, snapshot list |
| Snapshot view | Full session: logs, screenshots, device metadata |
| Data viewers | Dedicated interfaces for logs and screenshots |
Read: Console Structure
What's in the console
Snapshot sessions
Each snapshot is a full debugging session: logs with stacktraces, screenshots, and device context (platform, model, Unity version, who captured it). Everything is a shareable link.
Read: Snapshots
Log analysis
The log viewer lets you search all messages full-text, filter to errors, warnings, debug output, or command logs, expand any stacktrace inline, and select multiple entries to copy or share at once.
Read: Logs Viewer
Screenshot gallery
Screenshots are organized by capture time. Open any in a full-screen lightbox with zoom and touch support, or download and share directly.
Read: Screenshots Viewer
Team management
Invite team members with Owner, Admin, or Member roles. Each project uses a separate API key, so you can scope write access per project without sharing credentials across teams. You can run multiple projects under one team and track member activity across all of them.
Read: Team Management
Access control
Your data is isolated from other teams. Project-specific API keys control what the Unity plugin can write to each project, and role-based permissions control what each team member can do in the console.
Next steps
If you haven't set up the Unity side yet, start there first:
- Getting Started — install Jahro and connect to the web console
- Unity Snapshots — capture debug sessions from inside Unity
- Unity Commands — add runtime debug commands to your builds
- Unity Watcher — monitor variables in real-time on device