Unity Debugging Tools Compared (2026)
Unity debugging tools sit in a few buckets: on-device log consoles, native OS tooling, production crash reporting, and performance profilers. “Best” without a job in mind — solo iteration versus QA handoff versus what is happening in the App Store build — is the wrong question. Below is a map of the main options as of April 2026, with links to official sources so you can verify pricing and features yourself.
Last reviewed: April 2026.
Short version: Pick the category first (live session, crash aggregate, or GPU memory), then the product.
What teams actually use
Most mobile Unity teams eventually outgrow Debug.Log in the Editor alone. You still want Unity’s built-ins for profiling, native Android and iOS tools for OS-level signals, in-game consoles for builds on hardware, and often Firebase Crashlytics (or similar) for production. The real split is not whether logs matter — it is who can capture them and whether a session has to survive a device changing hands.
Forum threads repeat the same tension. On SRDebugger: “SRDebugger is great for a solo dev, but when we grew to a team of 5 QA people, having no shared dashboard became a real bottleneck.” On Lunar Console: “Great as a starting point. But the moment you have QA testers who aren't sitting next to a developer, it breaks down.” On ADB: “It's fine when you're at your desk. As soon as QA is remote, it stops working.” These are anecdotes, not benchmarks — they still match what shows up in retros when tooling does not fit how the team works.
“Best tool” here really means fit for team layout and platform.
Four categories (start with the job)
Separate what you are debugging: a live QA session, a native crash, fleet-wide production failures, or frame-level performance. The infographic below summarizes four buckets most teams mix.
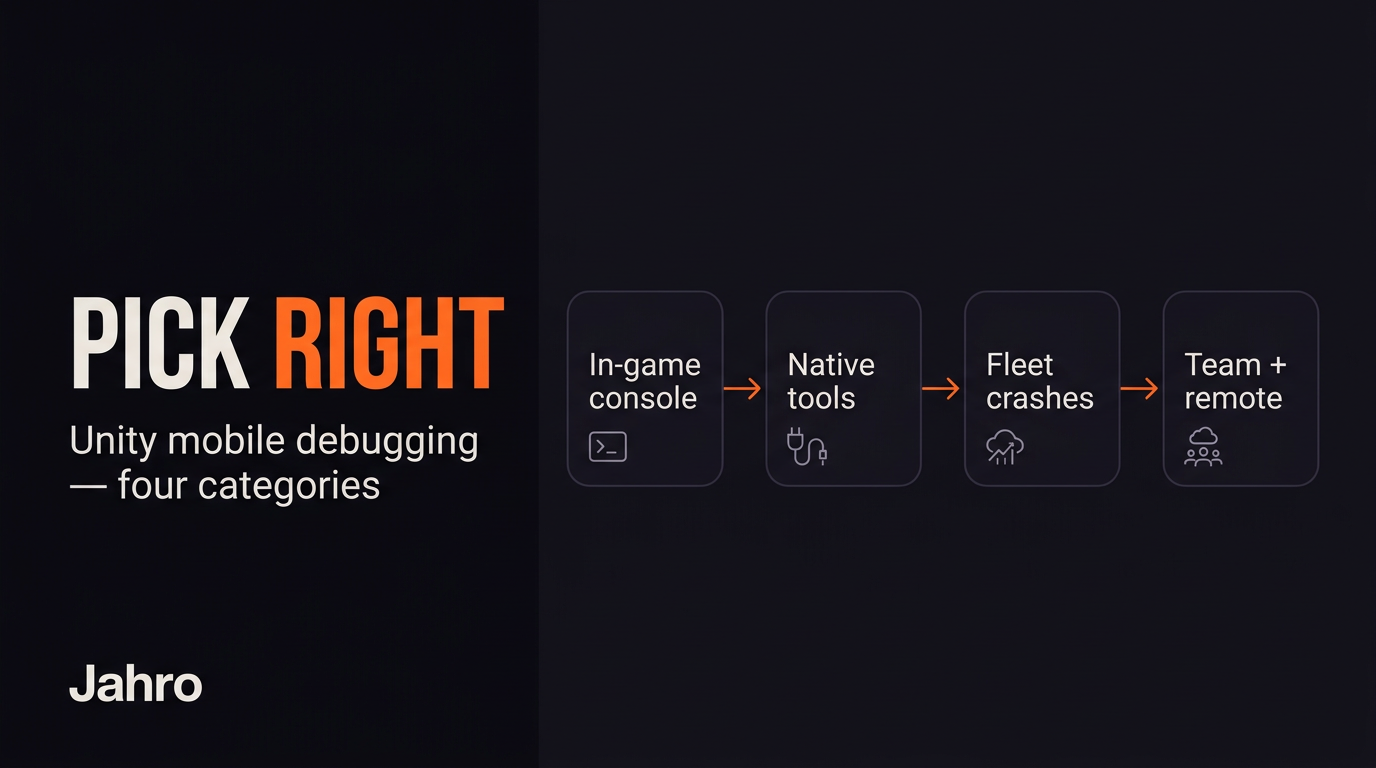
In-game consoles show Debug.Log on the device (SRDebugger, Lunar Console, Jahro’s overlay, and others). Native tools (adb logcat, Xcode’s Console and Instruments) read OS-level streams and deep profiles but assume developer setup. Fleet crash reporting (Firebase Crashlytics, and enterprise alternatives) aggregates post-release failures. Performance overlays like Graphy track FPS and memory as a HUD — they show up in screenshots next to consoles but answer a different question.
Log consoles handle story; Instruments handles where time and memory went.
Comparison matrix
This table comes from Jahro’s internal comparison work. ✅ means full support for the criterion; ⚠️ means partial or workflow-dependent; ❌ means not what the product is for.
| Criterion | SRDebugger | Lunar Console | ADB Logcat | Xcode / Console | Crashlytics | Unity built-ins | Graphy | Jahro |
|---|---|---|---|---|---|---|---|---|
| Price | ~$30 one-time | Free | Free | Free | Free / usage-based | Free | Free | Free Solo; paid Team+ |
| In-game console | ✅ | ✅ | ❌ | ❌ | ❌ | ❌ | ❌ | ✅ |
| Remote logs (no cable) | ❌ | ❌ | ⚠️ LAN wireless | ⚠️ same-network | ✅ post-crash | ❌ | ❌ | ✅ internet |
| Runtime commands | ⚠️ via SROptions | ❌ | ❌ | ❌ | ❌ | ❌ | ❌ | ✅ attribute-based |
| Team / QA collaboration | ❌ | ❌ | ❌ | ❌ | ✅ dashboard | ❌ | ❌ | ✅ |
| Session snapshot / share | ❌ | ❌ | ❌ | ❌ | ⚠️ crash-centric | ❌ | ❌ | ✅ shareable URL |
| iOS | ✅ | ✅ | ❌ | ✅ | ✅ | ✅ | ✅ | ✅ |
| Android | ✅ | ✅ | ✅ | ❌ | ✅ | ✅ | ✅ | ✅ |
| Desktop builds | ✅ | ❌ | ❌ | ❌ | ❌ | ✅ | ✅ | ❌ |
| Production crash fleet | ❌ | ❌ | ❌ | ⚠️ Organizer | ✅ | ❌ | ❌ | ❌ |
Official entry points: SRDebugger on the Asset Store, Lunar Console (GitHub), Android logcat, Firebase Crashlytics, Graphy.
No row wins every column — stacking tools is normal.
SRDebugger
SRDebugger (Stompy Robot) is a paid Asset Store package and a common default for on-device logging. As of the last pass: v1.13.1 (January 2026), minimum Unity 2022.3.62. The long gap between v1.12.1 (April 2022) and v1.13.0 (January 2025) made some buyers nervous about update cadence.
It hooks Debug.Log, warnings, and errors; supports filters and stack traces; ships a Bug Reporter with screenshot (email-oriented, not a team inbox); and exposes runtime options through a SROptions partial class instead of attribute discovery everywhere. Basic FPS and memory readouts exist; they are not a stand-in for Unity Profiler or Instruments.
Paid once (~$30), large install base, full source, no subscription — it shines when the person reading the log is holding the phone. The bug reporter path is something Jahro does not mirror one-for-one today.
There is no browser dashboard or shareable session URL. Licensing can get fuzzy across seats on some teams, and forum posts often boil down to QA cannot easily hand logs to engineering without screenshots or recordings.
Deeper head-to-head: SRDebugger vs Jahro.
Strong solo / on-device economics; a weaker async QA story.
Lunar Console
Lunar Console is Apache 2.0, free, and aimed at iOS and Android log overlays with native UI for lower overhead. It filters, searches, copies to clipboard, and supports email export — not a collaboration hub.
The Pro tier that would have added commands never turned into a maintained product line. That leaves a ceiling: “I hit the ceiling immediately when I needed runtime commands. Had to switch.”
Zero cost, open source, simple drop-in — a straight fit for “just show me logs on device.”
The free shipped build has no commands console, no remote access, and a feature set that has not moved much.
Hard to beat for read-only mobile logs on a budget; if commands or sharing land on your roadmap, plan an exit.
Deeper head-to-head: Lunar Console vs Jahro.
ADB Logcat (Android)
ADB is not Unity-specific — it streams the Android log buffer. Unity tags most messages with Unity, so adb logcat -s Unity is the usual filter. Docs: Android Debug Bridge.
Free, and hard to replace for ANRs, JNI, native crashes, and anything that happens before Unity’s logger is up. One developer put it this way: “I use ADB for the low-level stuff Unity hides — OS-level memory warnings, battery events.”
USB is the default; wireless adb tcpip works but needs setup and fights flaky LAN policies. Raw streams are noisy; QA without terminal habits hits a wall.
Keep ADB in the toolbox even if you add a game-centric console — it is the floor for Android platform diagnosis.
Focused comparison: ADB Logcat vs Jahro.
Xcode Console, Instruments, and Organizer
On iOS, Console.app and the Xcode toolchain are the native path: deep memory and GPU tooling, wireless pairing on newer versions (still not “anywhere on the internet”), and MetricKit / Organizer crash visibility for shipped builds.
This is still the place for certain iOS-native profiling and App Store crash workflows; there is no serious substitute for heavy GPU or allocation work.
macOS-only for the full suite; a steep curve if you live in Unity; QA without Macs cannot self-serve.
“QA can't use this — it's a developer tool through and through.”
You will still open Xcode for native iOS performance — log consoles do not remove that.
Firebase Crashlytics
Crashlytics captures crashes, ANRs, and non-fatals at scale, symbolicates stacks, and gives you a web dashboard the whole org can read — the usual choice for production.
It is not a live log tail. Reports show up after the fact; custom logs attach as breadcrumbs around crashes, not as a general-purpose console you browse. “Crashlytics is mandatory for production… But it doesn't help me during dev. I still need something I can actually interact with in real time.”
Use Crashlytics as fleet observability, not a replacement for QA session debugging.
Unity’s own toolbox
Unity gives you Debug.Log, the Editor Console (Editor-only), the Profiler with LAN autoconnect for development builds, Memory Profiler, and Player.log on disk. Reach for these for CPU spikes, rendering, and audio — the Profiler stays the right home for real performance work.
None of the built-ins give you a player-build log UI or shareable sessions by themselves.
Unity tooling for performance truth; consoles for human-readable session narrative on device.
Graphy (and similar HUDs)
Graphy is a MIT-licensed FPS/RAM HUD — not a log viewer. It pairs well with consoles because it answers “is this session melting down?” while logs answer “what did code say?”
Graphy vs Jahro is the wrong framing — they complement each other.
Jahro (disclosure: this site)
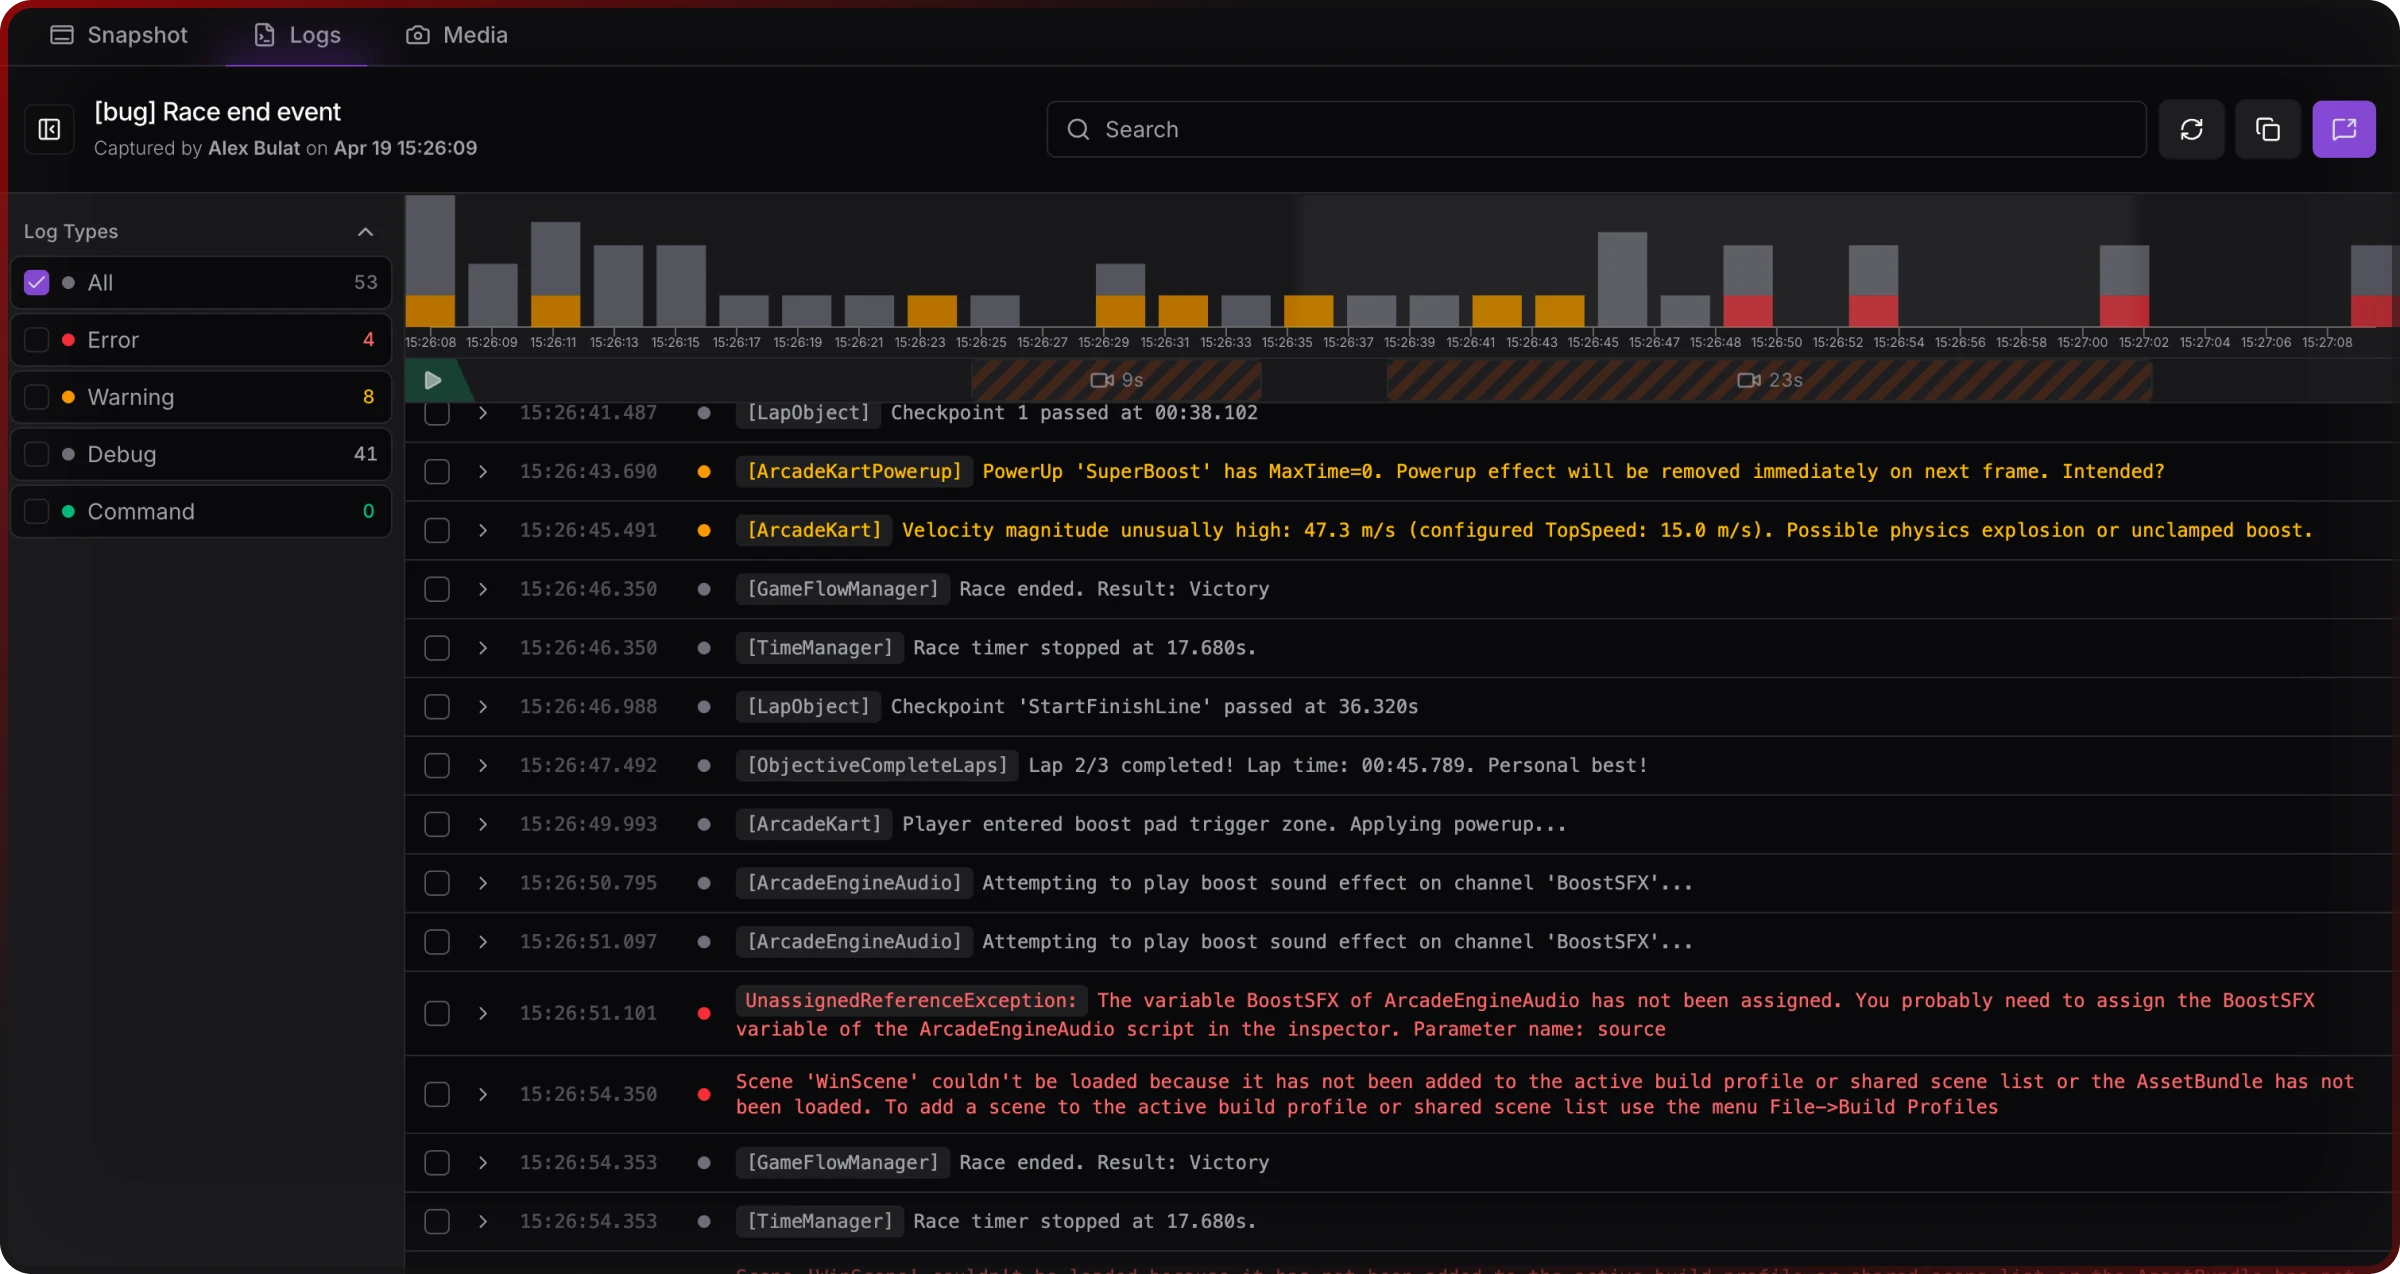
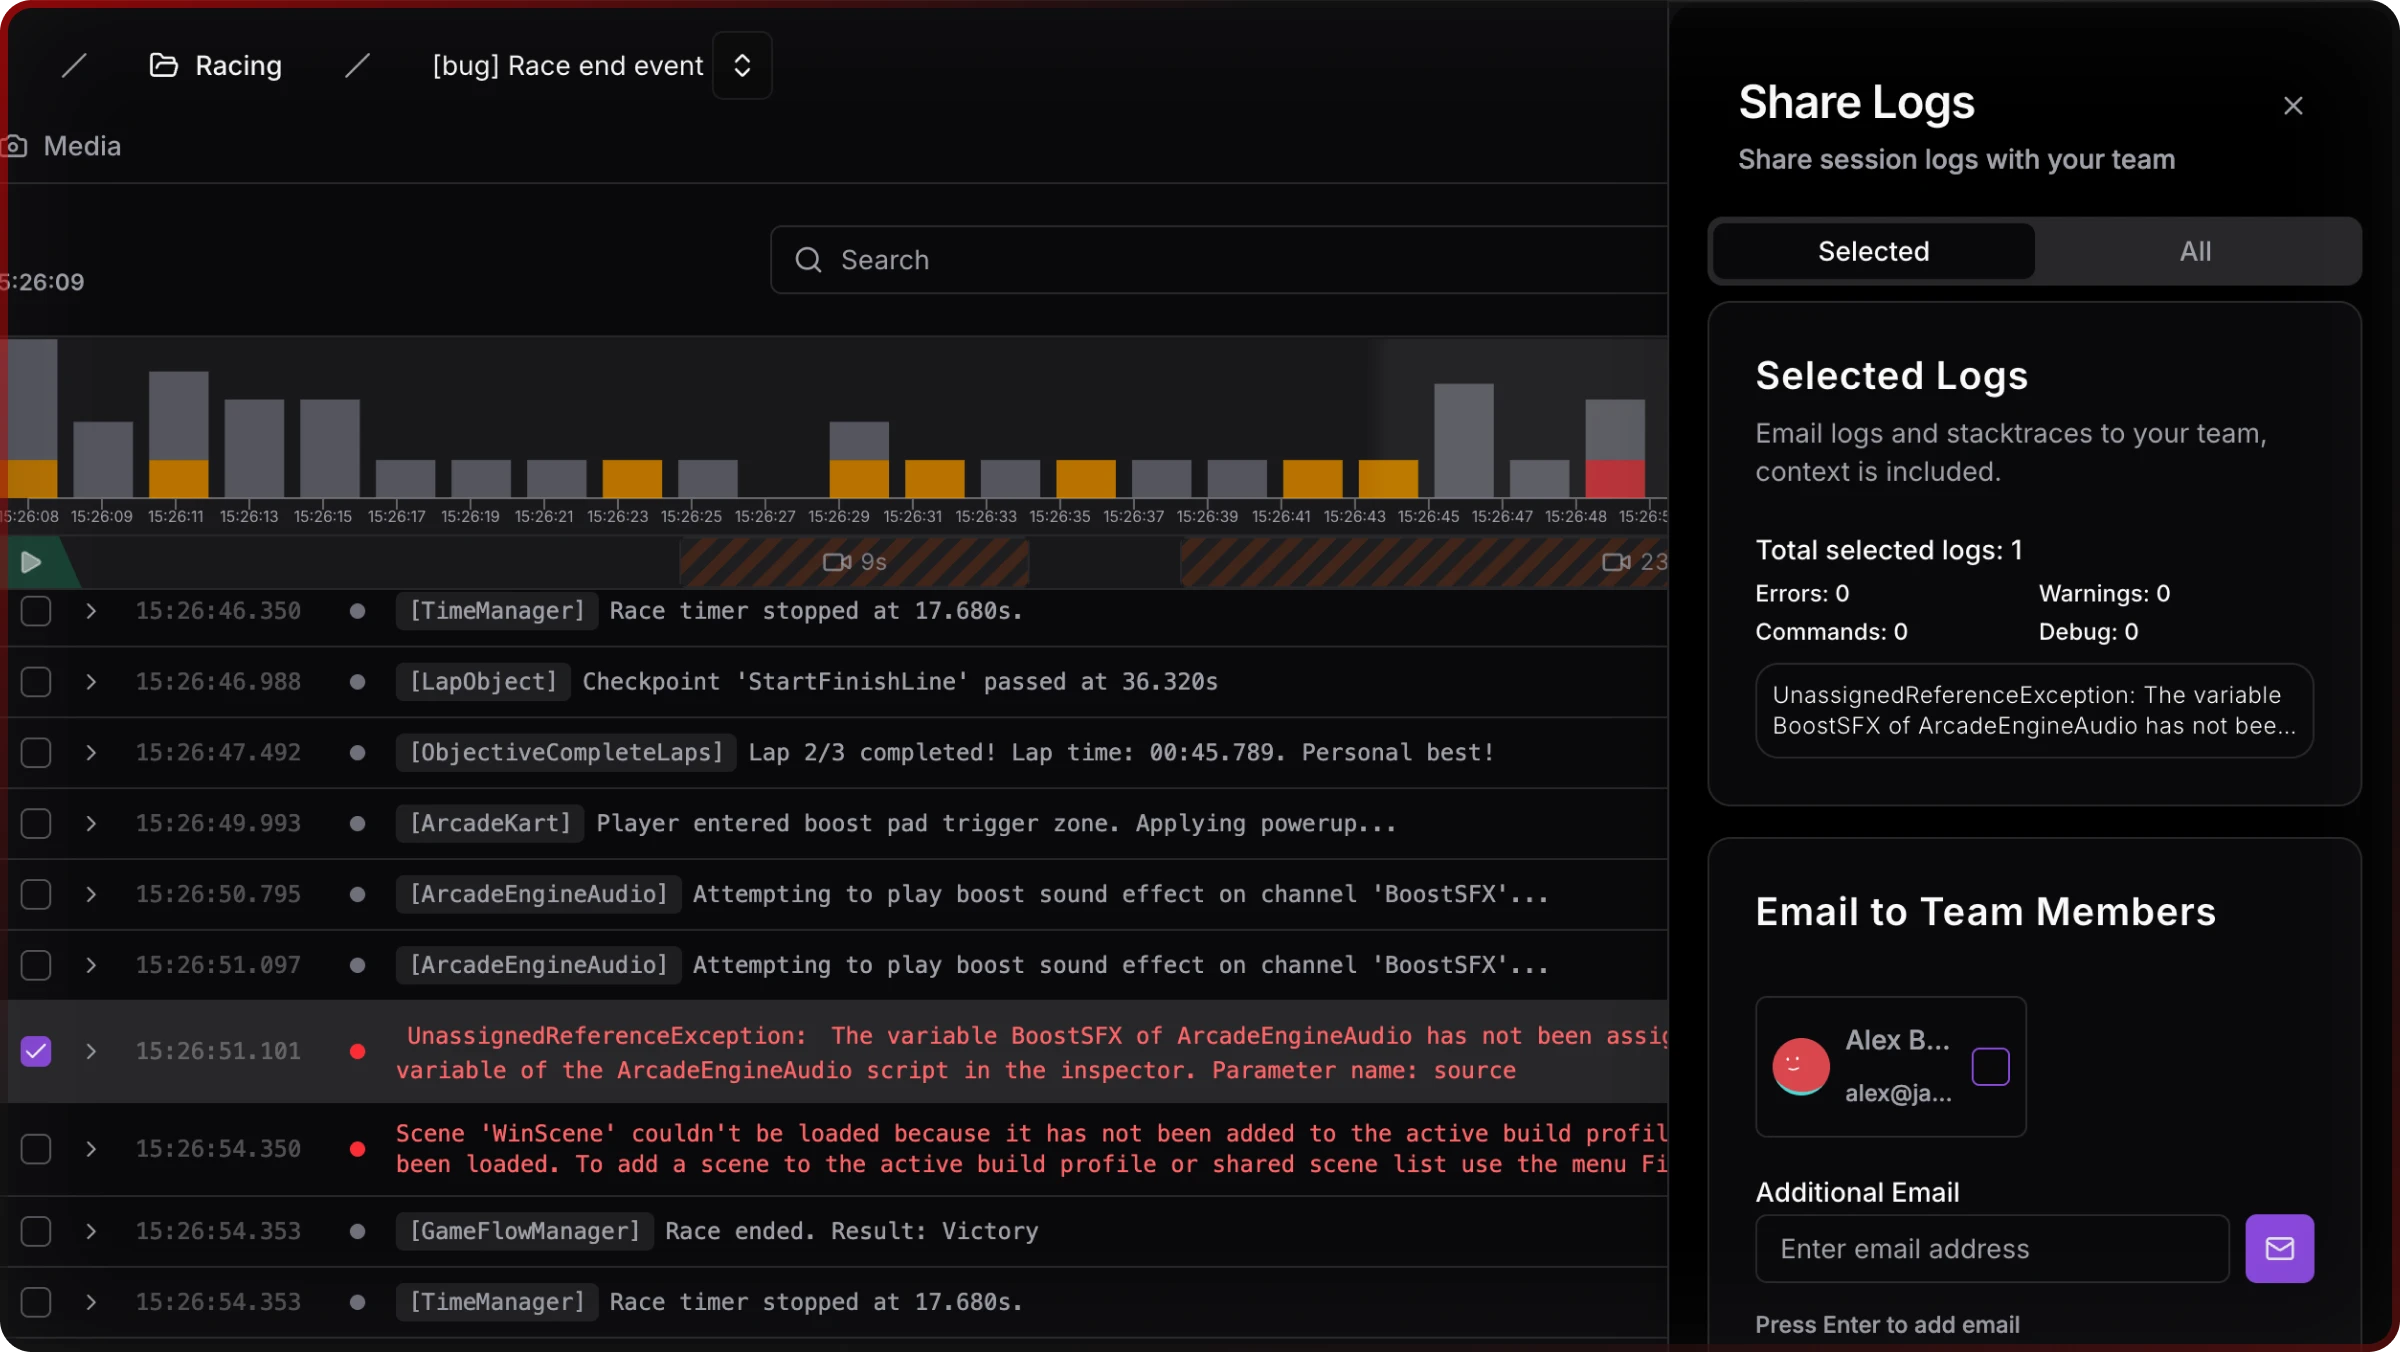
Jahro targets iOS and Android Unity builds with an in-game console, cloud-backed log streaming, attribute-based commands (remote-capable from the web dashboard), and session snapshots you can share as links — aimed at QA and distributed teams.
Internet-remote access without USB, multi-user web viewer, commands from device or browser, snapshot handoff that fits Jira-style workflows. The Solo tier is free; Team pricing is on /pricing.
Trade-offs: smaller ecosystem than SRDebugger; needs connectivity for remote features; not a replacement for Crashlytics or for Xcode-level profiling; no SRDebugger-style bug reporter parity; mobile-only — no PC or Mac player focus. Add Graphy if you want a constant FPS HUD.
“We use Crashlytics + Jahro. Crashlytics for production fleet, Jahro for the dev/QA loop.”
Jahro fits when who holds the device and who reads the log are not the same person.
Honorable mentions (enterprise and adjacent)
Sentry ships a Unity SDK for error monitoring with developer-centric grouping — worth a look if Crashlytics’ workflow does not fit. Backtrace (Perforce) targets larger studios with enterprise crash pipelines. Neither replaces an in-game console; they sit closer to Crashlytics than to SRDebugger.
Budget one production monitoring product and one dev/QA console — overlap is rare.
Common stacks
Minimum viable (solo mobile): Jahro Solo + Crashlytics — $0 recurring if you stay within free tiers.
Small team with QA: Jahro Team + Crashlytics + native tools (ADB / Xcode) for edge-case platform bugs.
Performance sprint: Unity Profiler + Xcode Instruments + Graphy overlay in QA builds — log consoles stay secondary.
Legacy SRDebugger installed: Some teams run SRDebugger on-device and add Jahro when they need remote review — both can coexist during migration.
Think stacks, not monoliths.
Quick decisions (SR vs Lunar vs ADB vs Crashlytics vs Jahro)
SRDebugger vs Jahro: Solo, always local, one-time purchase beats subscription math — SRDebugger. Multiple roles, remote QA, or shareable sessions — Jahro’s architecture.
Lunar Console vs Jahro: Read-only, zero budget, happy with an Apache 2.0 fork — Lunar. Commands or cloud handoff — Jahro (Solo is also free for individuals).
ADB vs Jahro: Native Android diagnosis — keep ADB. QA-scale log access without adb in PATH — different product category.
Crashlytics vs Jahro: Crashlytics for shipped crashes; Jahro for pre-release sessions. They do not substitute for each other.
Graphy vs Jahro: Performance HUD versus logs and commands — pair them.
If you know team size, platform, and live versus production, the tree gets simple fast.
FAQ
What is the best Unity debugging tool for mobile?
Depends on team size and job. Solo devs who only need on-device logs often use SRDebugger or Lunar Console. Teams that need QA to share sessions without cables add a remote-capable workflow. Shipped games still need Crashlytics-class reporting. CPU and GPU work belongs in Profiler and native instruments.
Can I debug a Unity game on my phone without USB?
Android: classic ADB expects USB; wireless ADB is possible but LAN-bound and fiddly. iOS: Xcode wireless debugging is still local-network scoped. True internet-remote access needs tooling built for cloud streaming — not raw platform bridges.
What is the difference between SRDebugger and Jahro?
SRDebugger is on-device, one-time purchase, strong bug reporter for email. Jahro adds web dashboard, shareable snapshots, and remote commands — different collaboration model.
Is Lunar Console still maintained?
Compatibility maintenance continues; the Pro/commands path did not ship as an ongoing product. Expect stability, not rapid feature growth.
Does Firebase Crashlytics replace an in-game console?
No — Crashlytics is post-crash production monitoring. In-game consoles serve live dev/QA iteration.
How do I let QA testers see Unity logs without a developer machine?
Avoid requiring ADB or Xcode for routine QA. Use in-build capture with a web review path, or accept manual export friction.
What Unity debugging tools work for remote teams?
LAN-only tools fail when people are distributed. Internet-remote products and shareable links address that gap; native profilers remain local.
SRDebugger vs Lunar Console — which should I use?
SRDebugger if you need its Options/cheats system and broader platform support. Lunar if you only need a free mobile log overlay and will not need runtime commands.
Sources and further reading
- Stompy Robot — SRDebugger product page
- Space Madness — Lunar Unity Console (GitHub)
- Google — Firebase Crashlytics
- Google — Android
logcatoverview - Apple — Xcode and Instruments (via Mac App Store documentation)
- Unity — Profiler documentation
- Internal comparison — Jahro strategy brief Unity Debugging Tools — Complete Comparison Guide (April 2026)
Related Jahro comparisons: Jahro vs SRDebugger, Jahro vs Lunar Console, ADB Logcat vs Jahro. Related guide: The State of Unity Mobile Debugging: 2026.
Vendor features and prices change — check official sites before you buy or integrate.