Unity Snapshot System — Capture & Share Bugs
Snapshots solve the "I can't reproduce this" problem: one tap captures your Unity device logs, screenshots, and device context into a shareable link.
No cables. No ADB or Xcode. Your QA tester captures it on-device; you get the full session via a URL in the web console.
What a snapshot captures
Each snapshot session bundles:
- Unity logs —
Debug.Log, warnings, errors, and command output, with stack traces and line numbers - Screenshots — taken on demand at any point during the session
- Device context — platform (Android/iOS), OS version, device name, Unity version, and which team member captured it
Logs stay on-device until you upload or stream them to the web console. In the web console, logs are searchable and the session has a shareable URL.
Capture Unity device logs without cables
Without Jahro:
- Connect a USB cable
- Enable developer options on the device
- Run
adb logcator open Xcode → Devices - Filter out system noise manually
- Export logs and attach to a bug report
With Jahro snapshots:
- Open the Jahro console in-game
- Tap Start Snapshot
- Reproduce the issue
- Tap Stop Snapshot
- Copy the URL and share it
Snapshot modes
Choose your mode in Tools → Jahro Settings. The active mode is shown in the Snapshots view.
| Mode | Behavior | Best for |
|---|---|---|
| Recording | Logs stay local until you upload | Offline dev, privacy-sensitive projects |
| Streaming (all) | Logs and screenshots stream every ~5s | Real-time team collaboration |
| Streaming (except Editor) | Streams on-device; records locally in Editor | Device testing with private Editor sessions |
Streaming behavior
Jahro sends logs and screenshots in chunks every ~5 seconds. Duplicate logs within the same chunk are collapsed to reduce data sent.
Session statuses
| Status | Meaning |
|---|---|
| Recording | Actively collecting logs and screenshots |
| Recorded | Finished locally — ready to upload |
| Streaming | Live-streaming to the web console |
| Streamed | Stream complete and fully uploaded |
| Uploading | Upload in progress |
| Uploaded | Upload complete — URL is available |
If a network error occurs, you'll see an inline error with a Retry button.
Jahro keeps the 10 most recent snapshots locally. Older sessions roll off automatically.
In-game interface
Open Jahro and switch to the Snapshots tab. Two sections are shown:
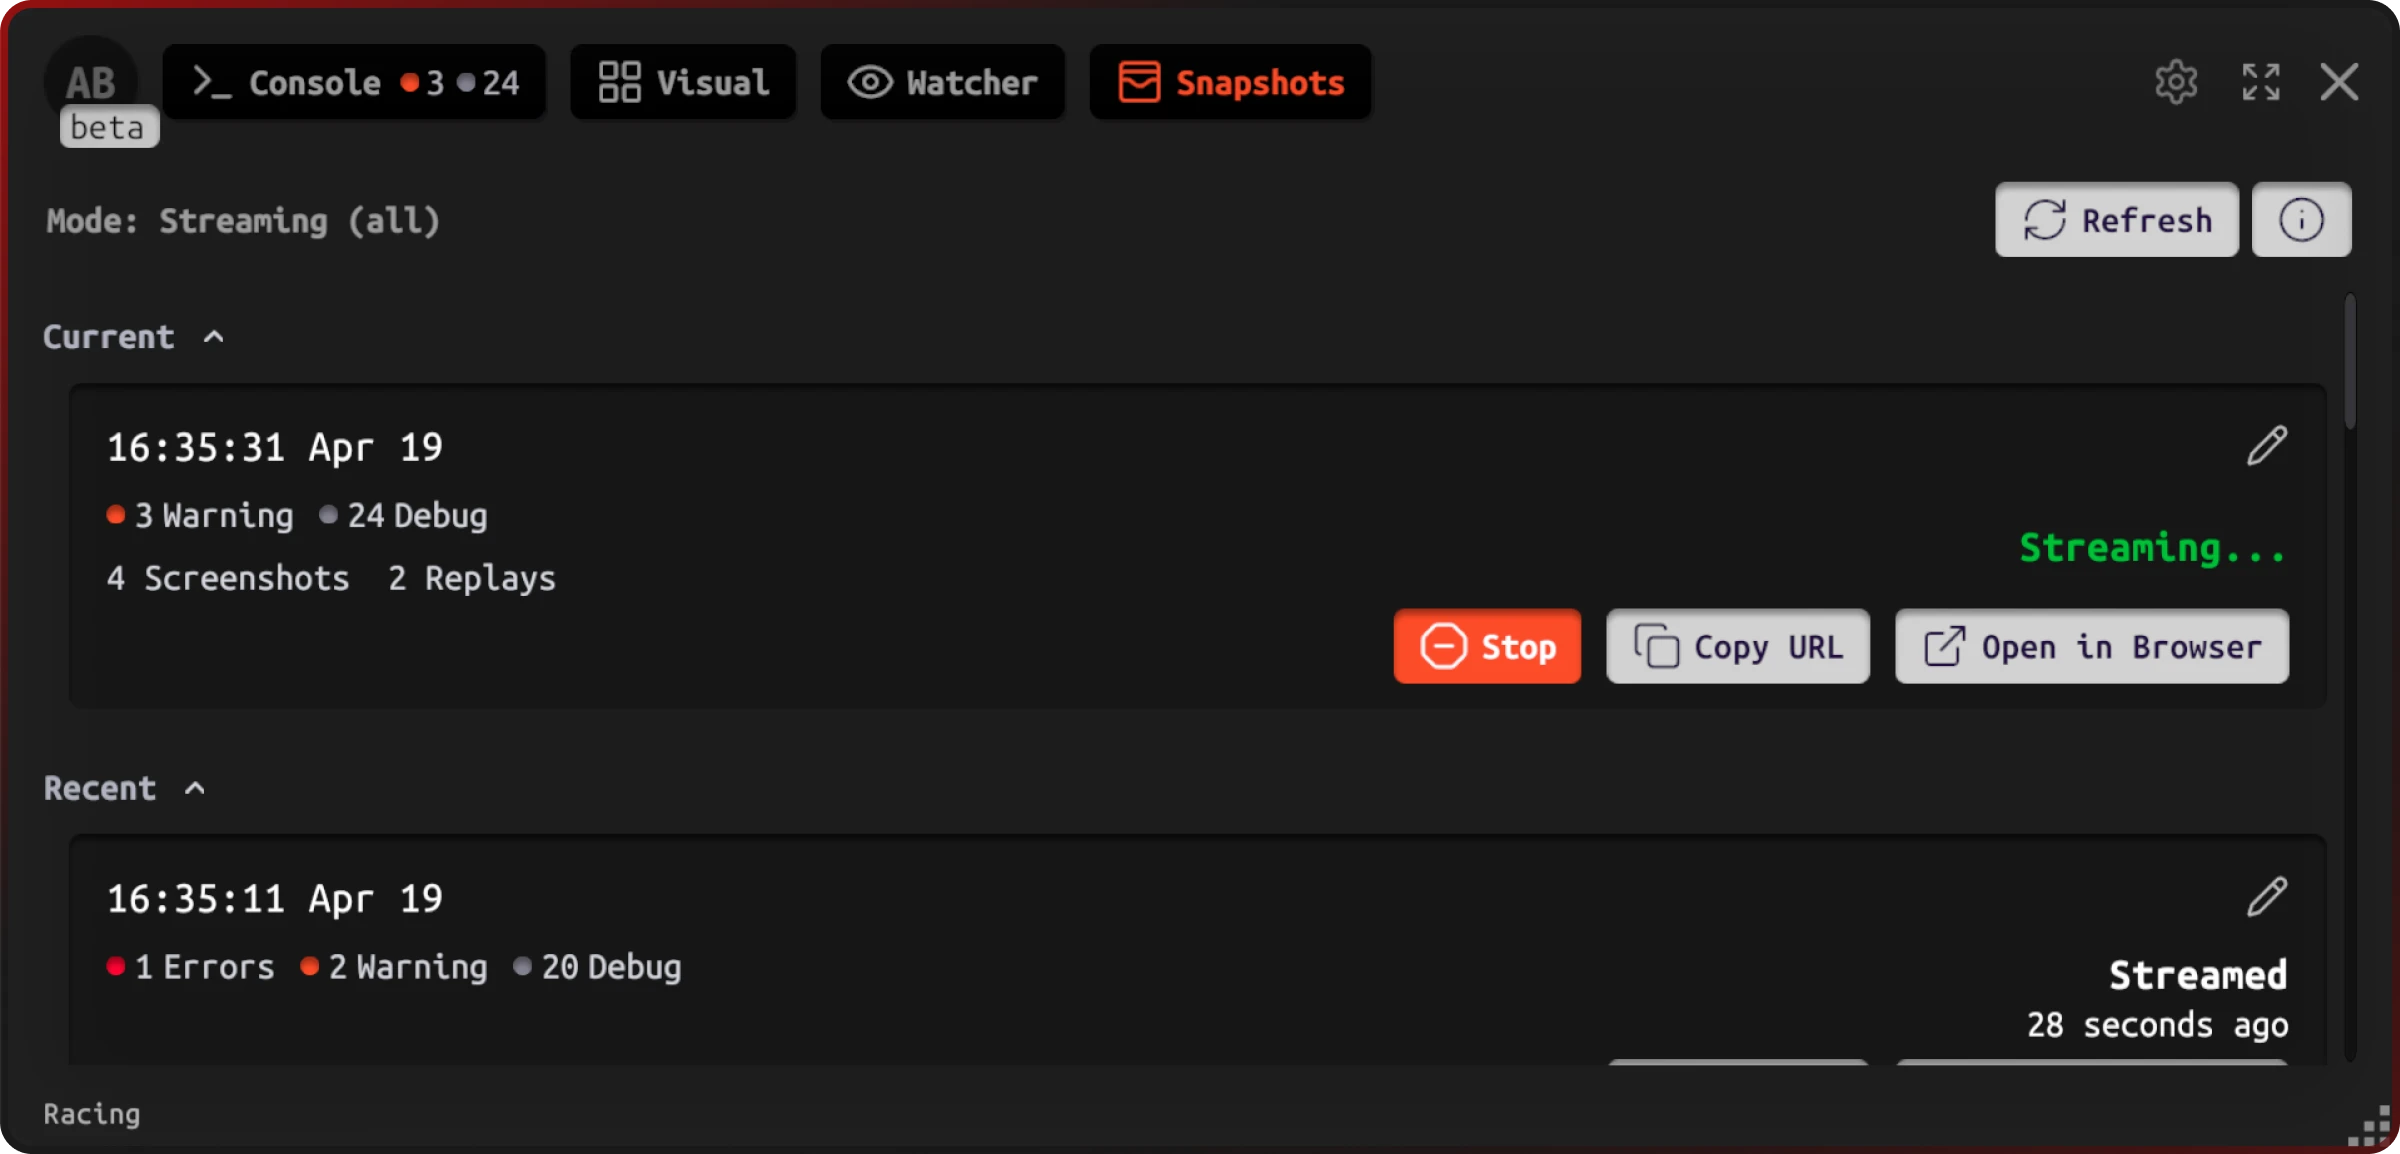
- Current — your active session
- Recent — previously recorded, streamed, or uploaded sessions
Each session card shows the title (editable), log counters (Debug / Warning / Error / Command / Screenshots), and action buttons: Stop, Upload / Retry, Copy URL, Open in browser.
To rename a session, tap the pencil icon. Names can be up to 100 characters.
Web console
All uploaded and streamed snapshots appear in the web console. From there you can filter and search logs, browse screenshots, and share the session URL with anyone on your team. They don't need Jahro installed.
AI-assisted snapshot configuration
The snapshots agent skill teaches your AI coding assistant to recommend the correct snapshot mode, configure QA workflows, and set up web console integration for your team.
Tell your AI: "Set up snapshots so QA testers can capture bugs and share them with developers" and it selects the right mode for your workflow and walks through the full setup.
Frequently asked questions
What does a Jahro snapshot include? Each snapshot captures all Unity logs (debug, warnings, errors, command output), screenshots taken during the session, and device context (platform, device name, Unity version, team member). Everything needed to reproduce a bug in one shareable link.
How do I share Unity device logs with my QA team? Start a snapshot from the Jahro console, reproduce the issue, and tap Stop. Copy the URL and share it. Your team sees the full log history and screenshots in the web console without needing Jahro installed.
Can snapshots help with device-specific bugs that can't be reproduced on a developer's machine? Yes. Snapshots capture the exact device context: Android/iOS version, hardware configuration, and the full log sequence leading up to the bug. You get the full picture without borrowing the tester's device.
What is the difference between Recording and Streaming modes? Recording stores everything locally until you upload. Streaming sends logs and screenshots to the web console every ~5 seconds as you play. Use Recording for offline or privacy-sensitive work; Streaming for real-time team collaboration.
Related docs
- Unity Log Viewer — view and filter device logs in-game before or after capturing a snapshot
- Unity Runtime Inspector — monitor variable values live during a session
- Unity Console Commands — run debug commands while a snapshot is recording
- Getting Started — install Jahro and capture your first snapshot