Web Logs Viewer — Unity Log Analysis
Unity's built-in console is editor-only. The Web Logs Viewer is where you read and analyze every log captured during a Jahro snapshot session.
When a snapshot session ends, all captured logs are available in the web console. Every Debug.Log, warning, error, exception, and Jahro command from the session shows up in a searchable, filterable table with millisecond timestamps and expandable stacktraces. Select any subset to copy or share with teammates.
Opening the Logs Viewer
- Go to your project dashboard
- Click a snapshot session in the snapshots list
- Select the Logs tab
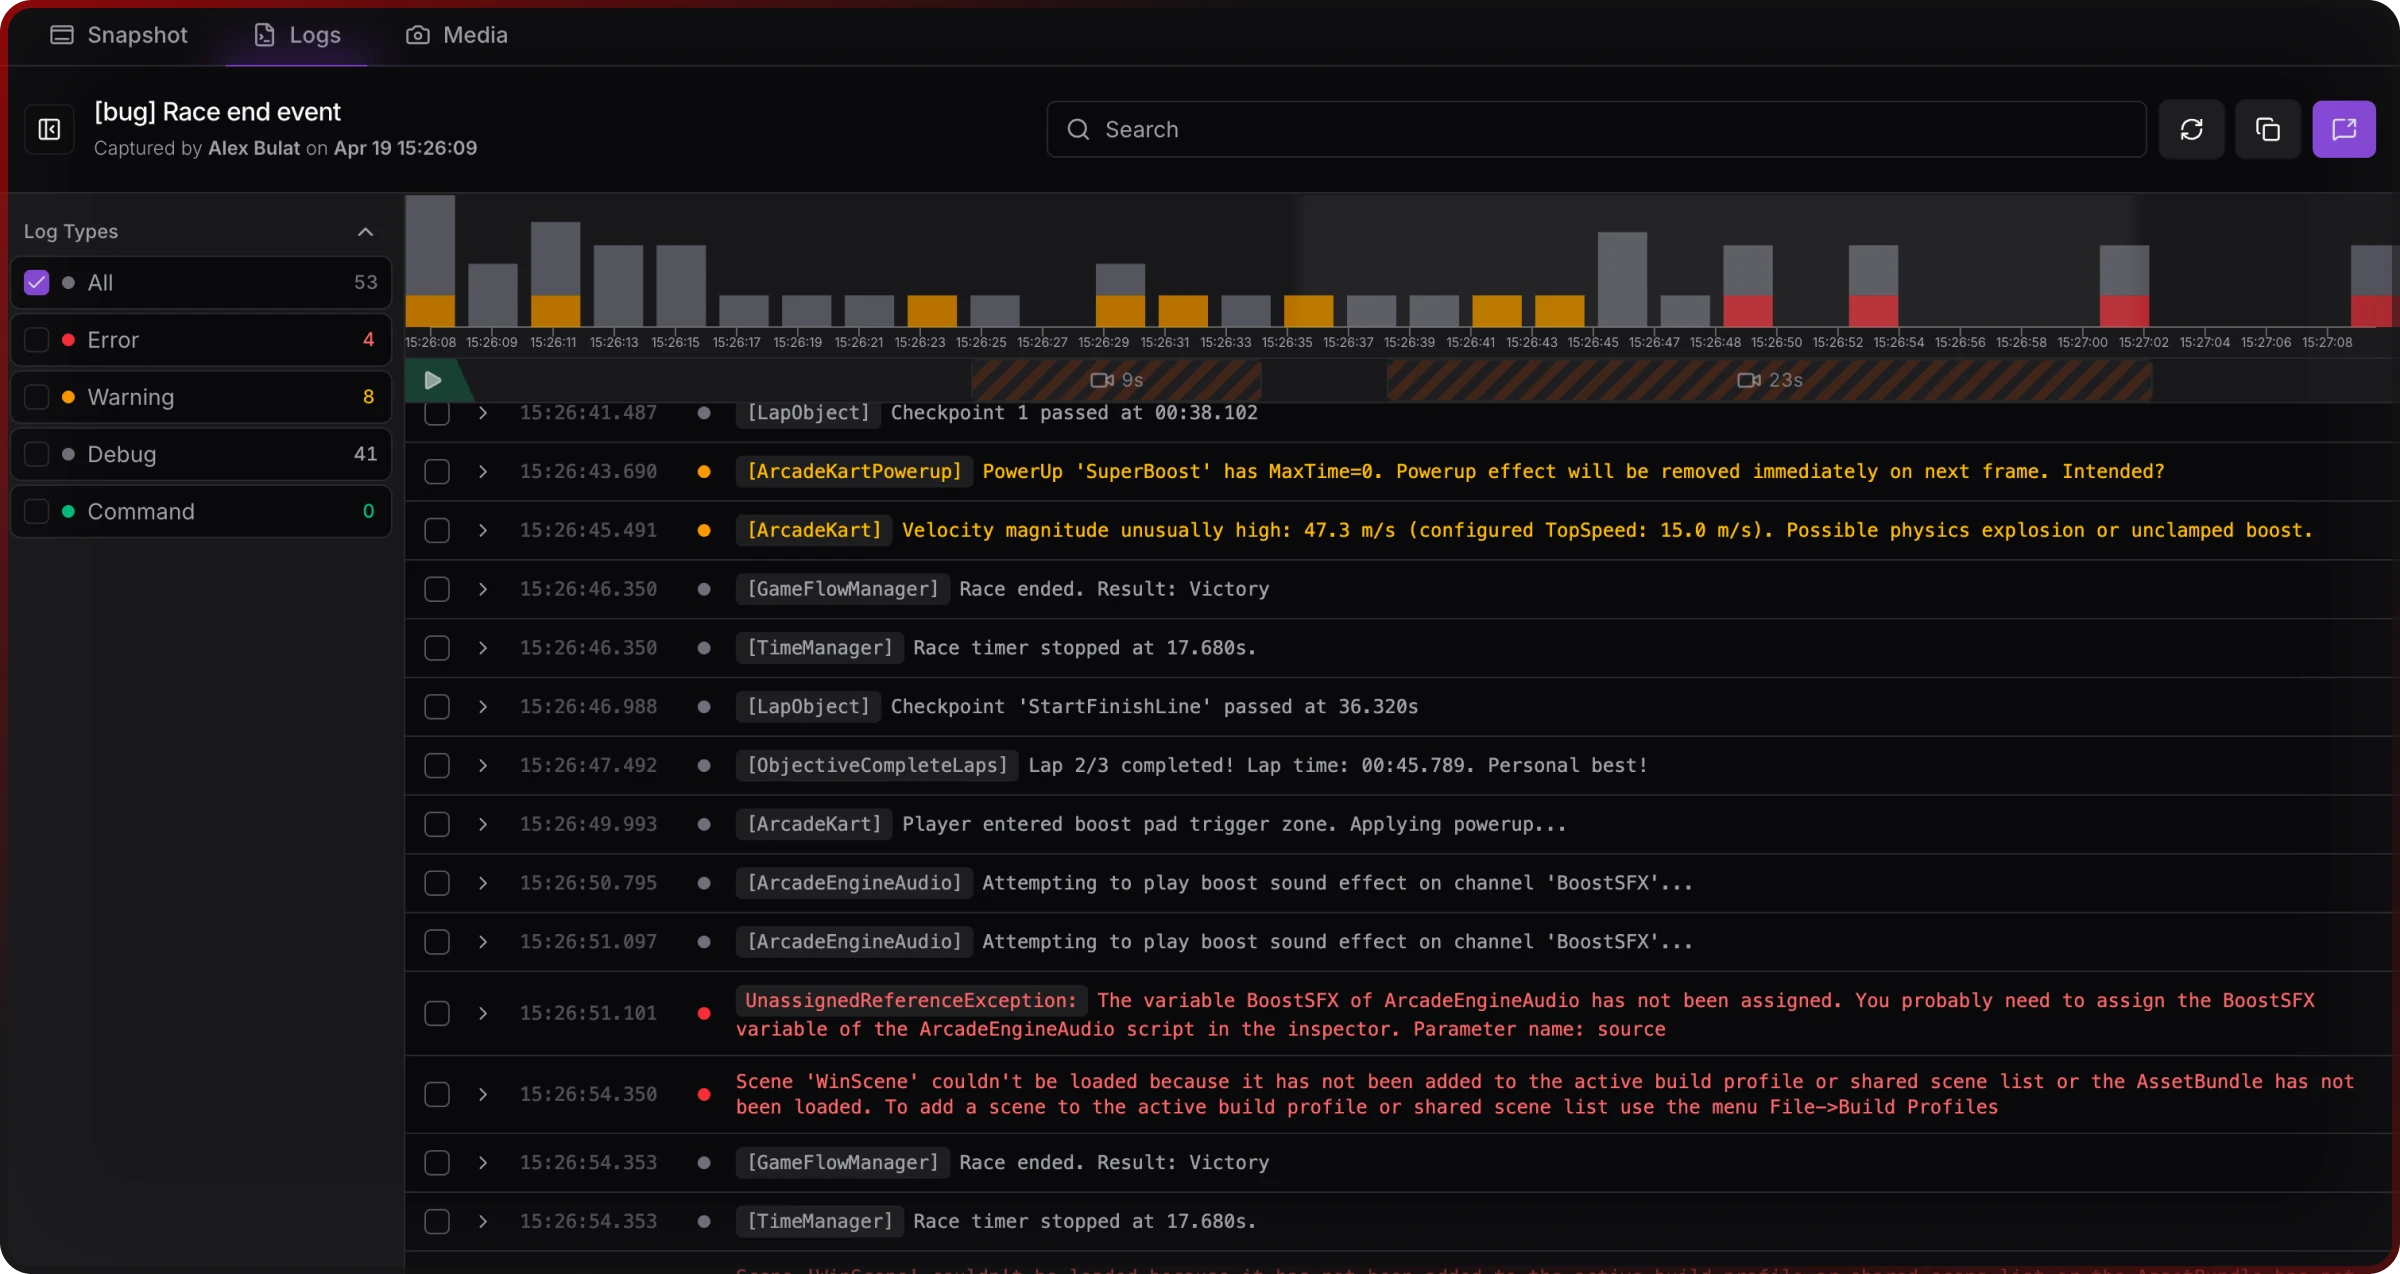
Logs load in chronological order for the selected session.
Log types
The viewer displays five log types, each color-coded:
| Type | Color | Source |
|---|---|---|
| Debug | White/gray | Debug.Log() |
| Warning | Yellow | Debug.LogWarning() |
| Error | Red | Debug.LogError() |
| Exception | Red | Unity exception handling |
| Command | Green | Jahro internal commands |
Each row shows a millisecond-precision timestamp (HH:mm:ss.SSS), the log message, a duplicate counter for repeated identical logs, and a selection checkbox.
Filtering and search
Filter by log type
Click Filter in the toolbar to open the sidebar panel. Under Log Type, check or uncheck types to show or hide them. Each type toggles independently.
Search
The search bar filters log messages in real time as you type. Search is case-insensitive and matches within message content. Clear the field to restore all logs.
Viewing stacktraces
Click any error or exception row to expand its stacktrace inline. The expanded view shows the complete call stack with file names and line numbers in monospace type. Click the row again to collapse it.
Selecting, copying, and sharing logs
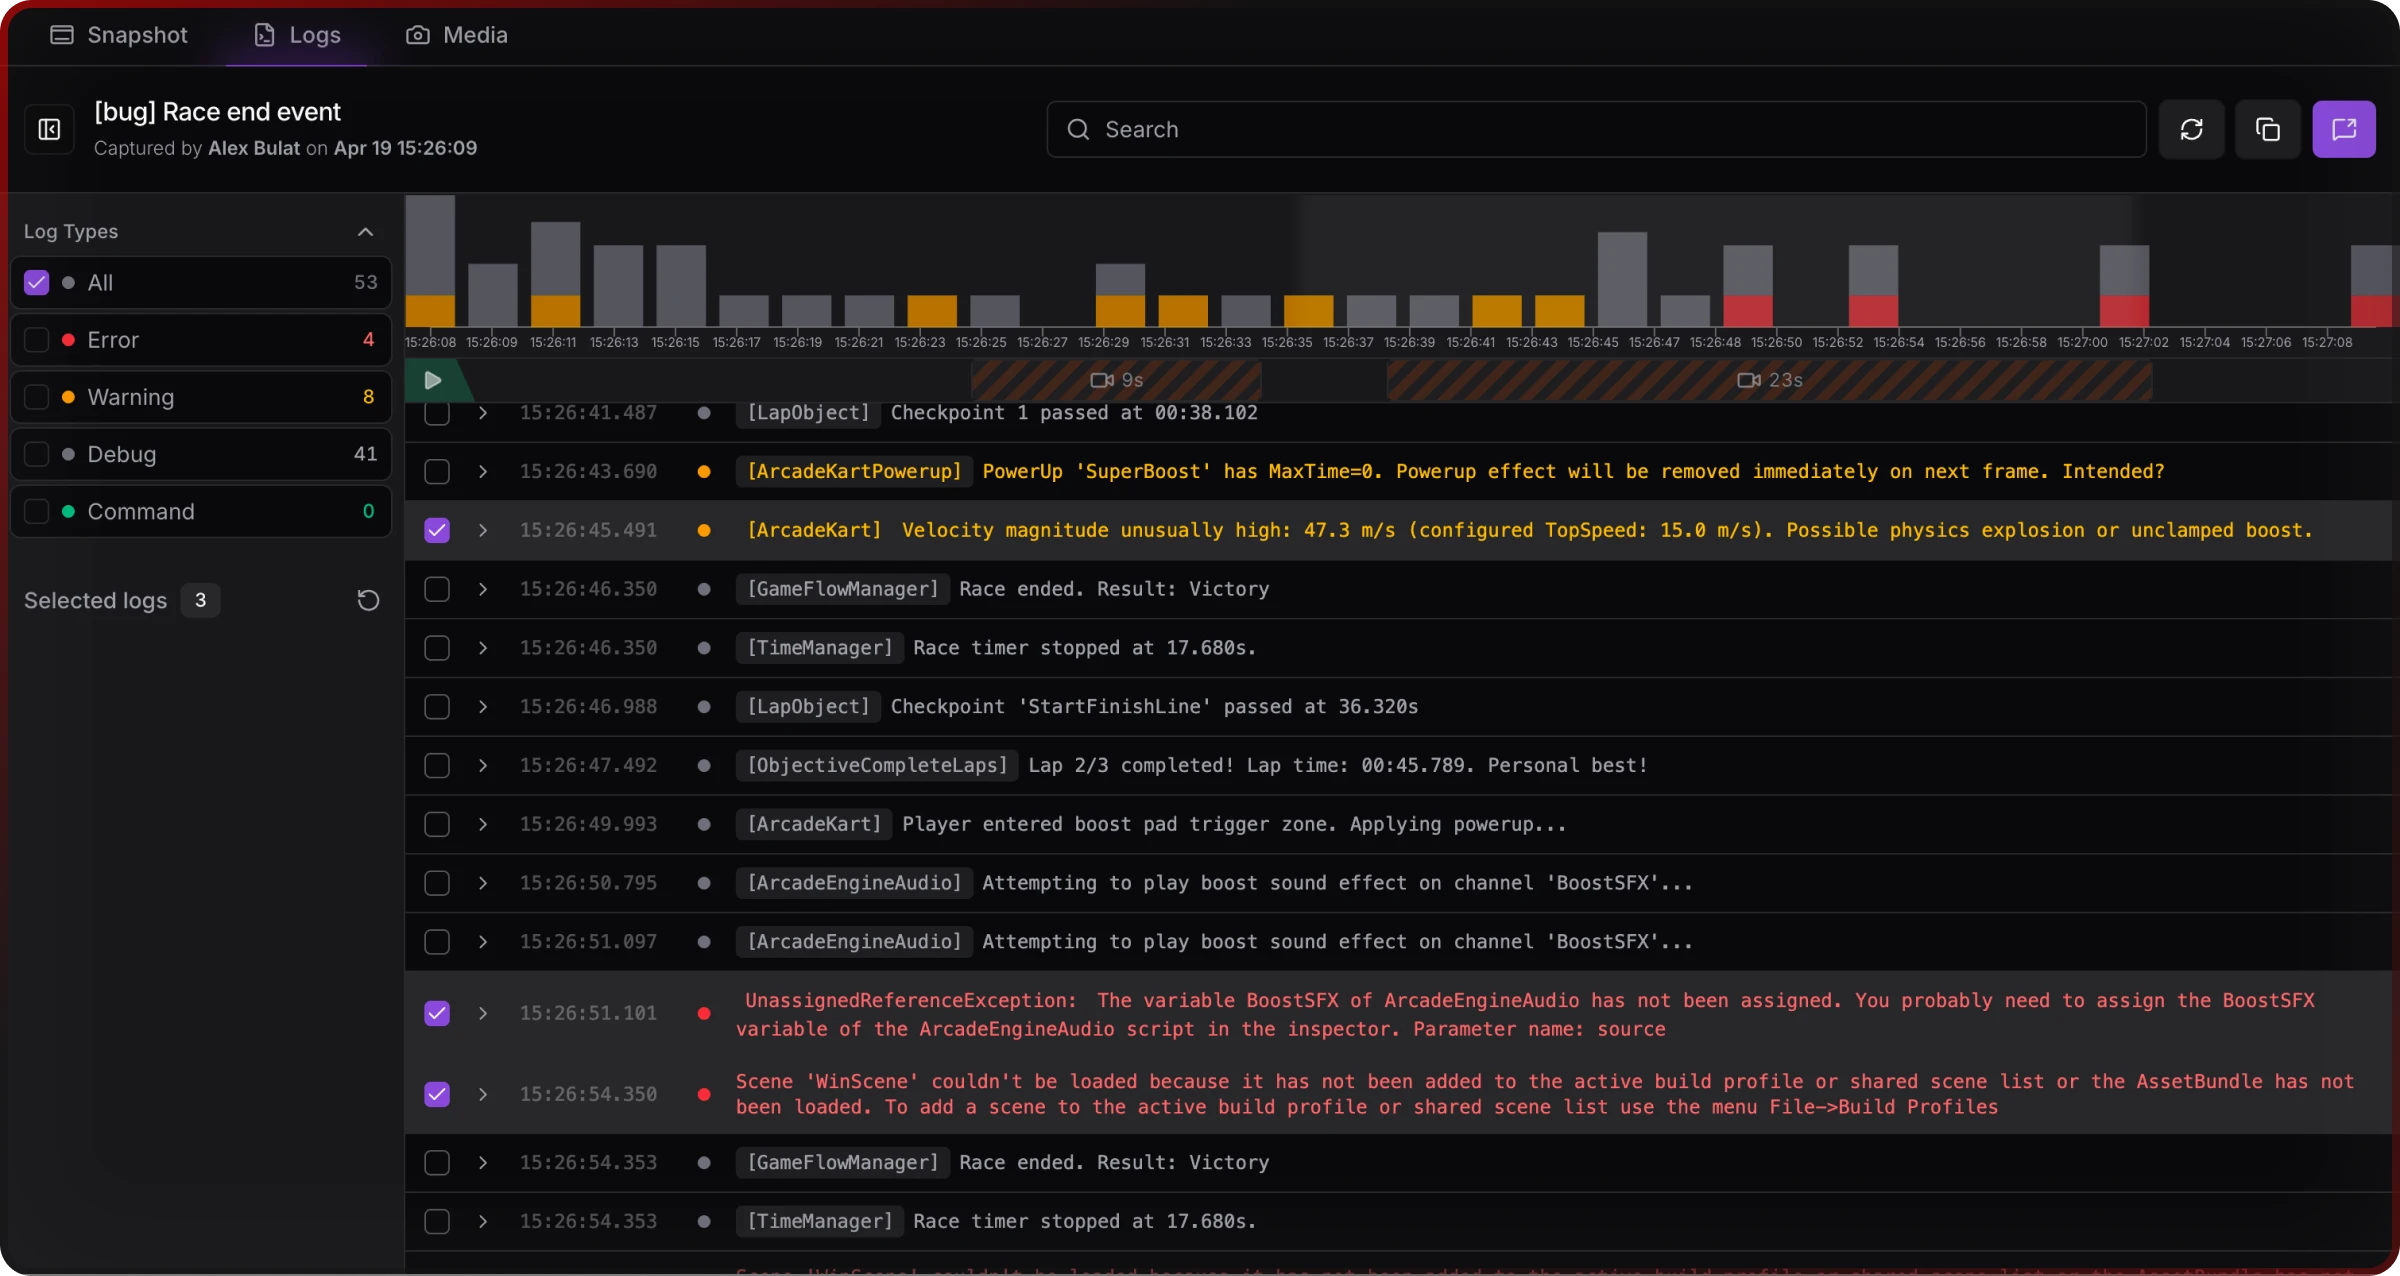
Select logs
Check the checkbox on any log row to select it. The sidebar shows how many logs are selected. Click Reset to clear all selections.
Copy logs
Select one or more logs, then click Copy or press Ctrl+C (Windows) / ⌘+C (Mac). The clipboard output includes timestamps and log type:
[2024-01-15 14:30:25.123] [ERROR] NullReferenceException: Object reference not set
at PlayerController.Update() (at Assets/Scripts/PlayerController.cs:45)
at UnityEngine.Component.SendMessage()
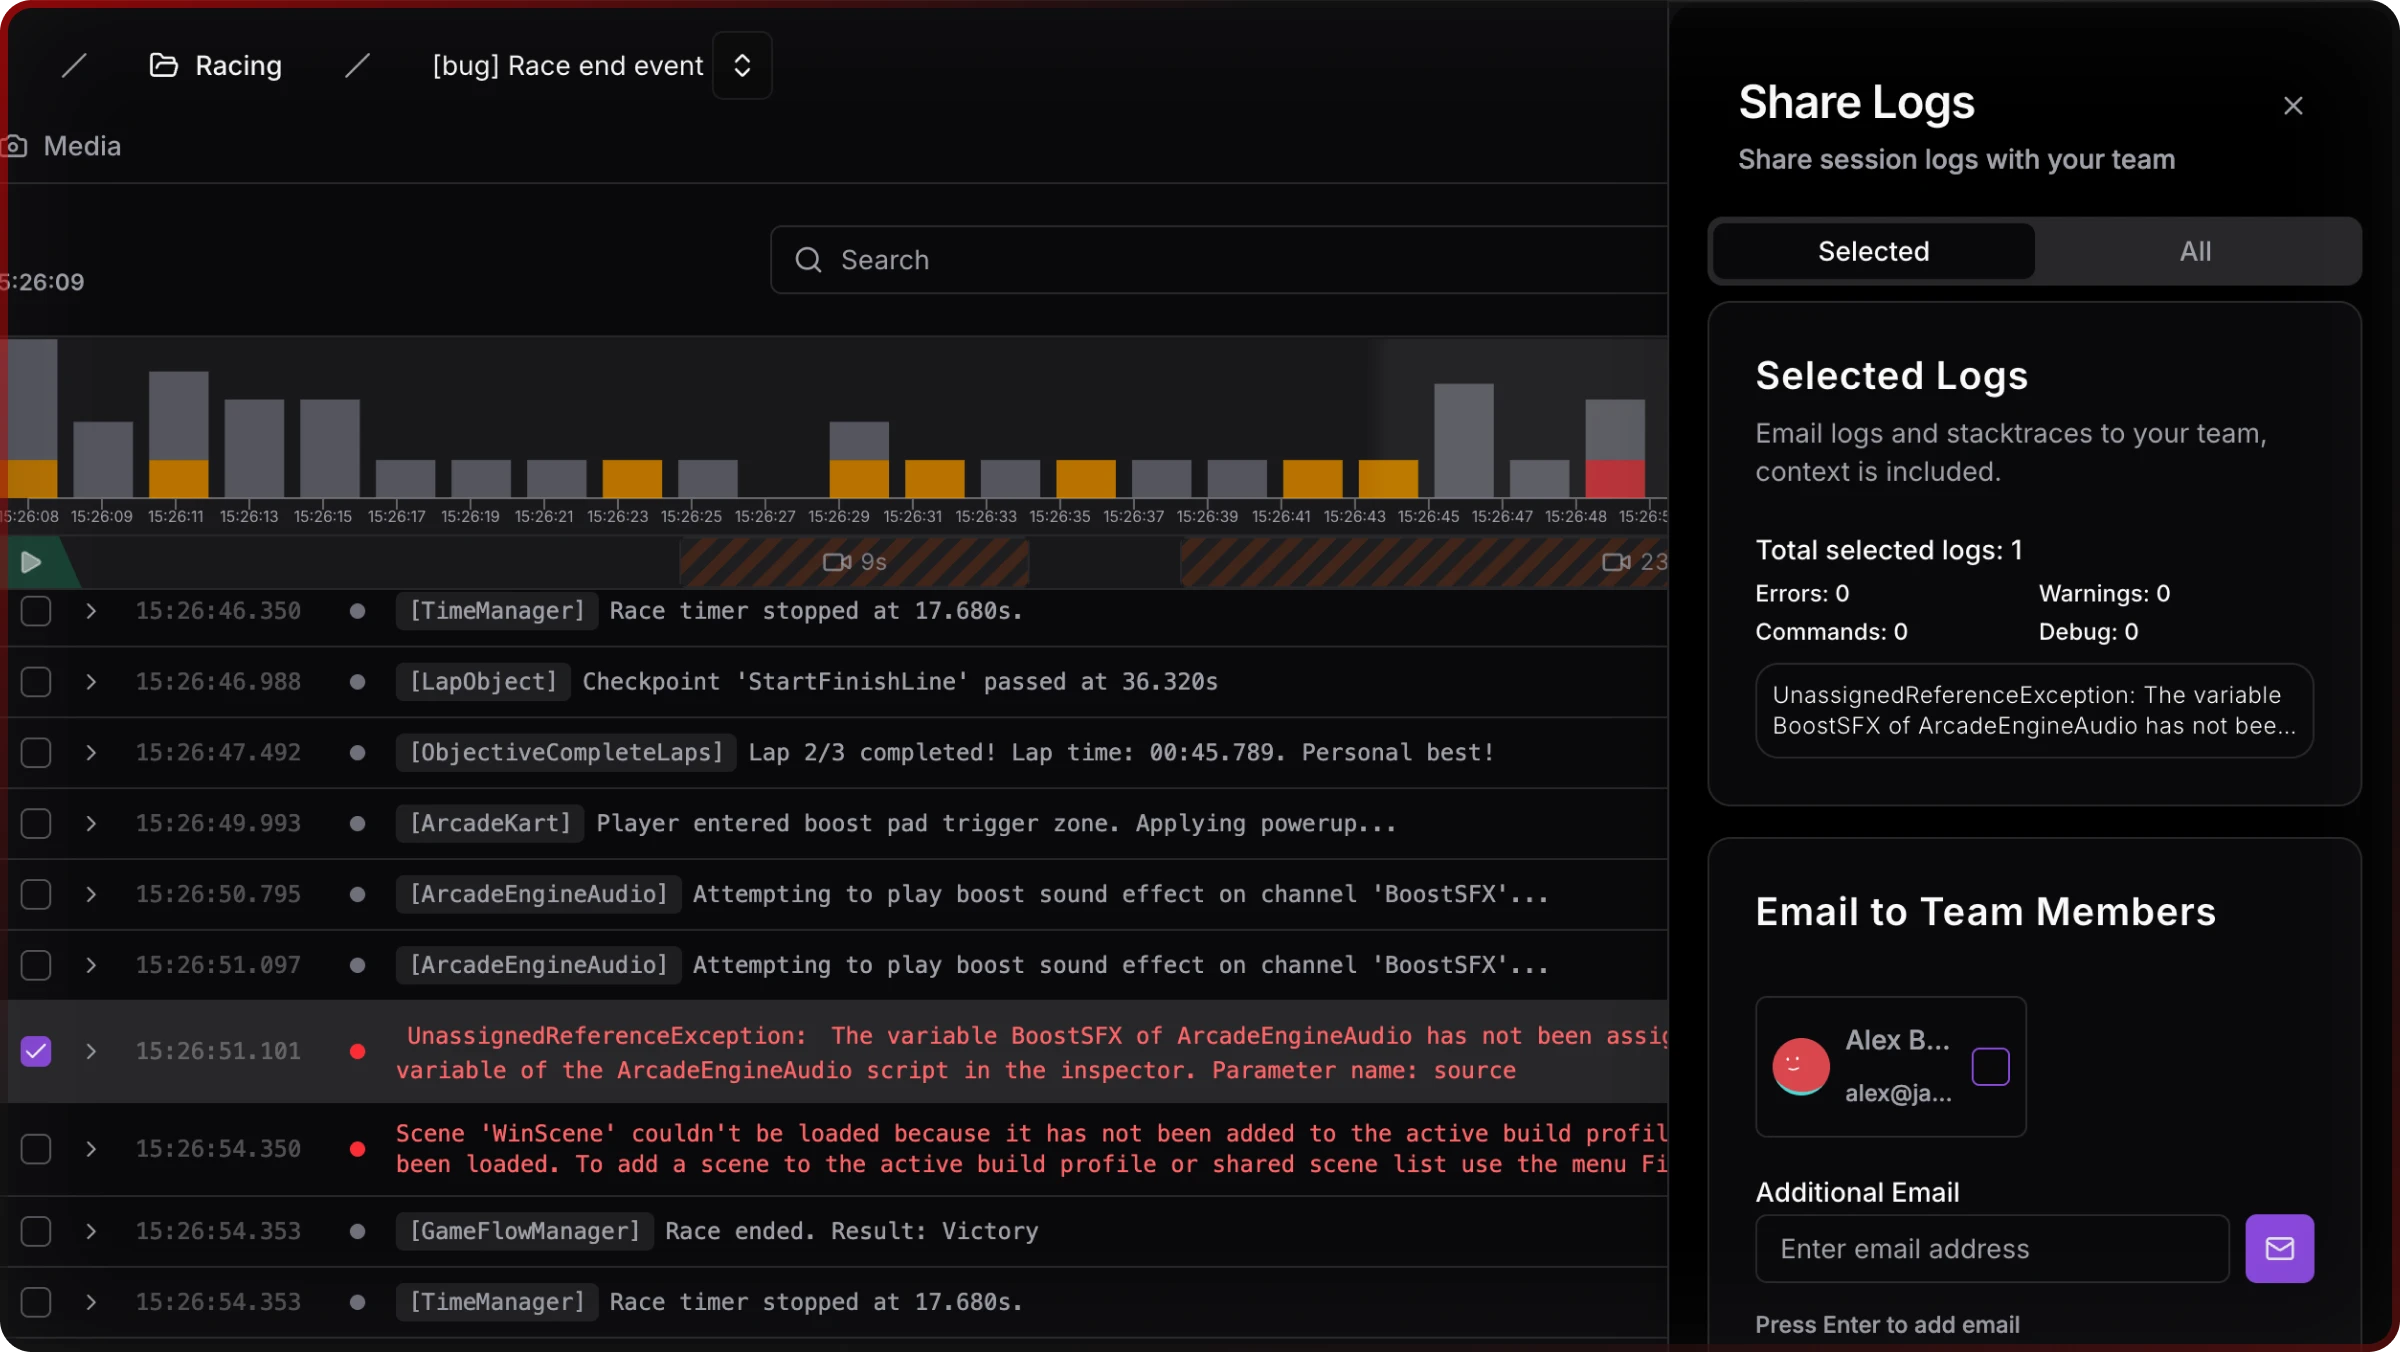
Share logs with your team
Either way, the share includes session context automatically: Unity version, project version, target platform, device name, capturing team member, and snapshot timestamp.
Share selected logs:
- Check the logs you want to share
- Click Share in the toolbar
- Open the Selected tab
- Add teammate emails and an optional message
- Click Share X Selected Logs
Share the full session:
- Click Share without selecting specific logs
- Open the All tab
- Copy the session link, or add emails to send directly
Things to know
- Search matches message content only. If you need logs from a specific time window, scan the timestamp column visually — the search field won't filter by time.
- Stacktraces only expand on Error and Exception rows. Debug and Warning rows don't have an expandable view.
- Repeated identical logs are collapsed into one row. The duplicate counter tells you how many times that exact message fired. Worth checking before you assume a log only ran once — tight loops can inflate counts fast.
Related
- Snapshots — How snapshot sessions are created and managed in the web console
- Screenshots Viewer — Browse screenshots captured in the same session
- Unity Logs — The in-game log viewer for on-device debugging
- Unity Snapshots — Capturing a debug session from within Unity