Snapshots — View & Share Unity Debug Sessions
Once your QA tester uploads or streams a session from the device, it shows up here — ready to read, filter, and share.
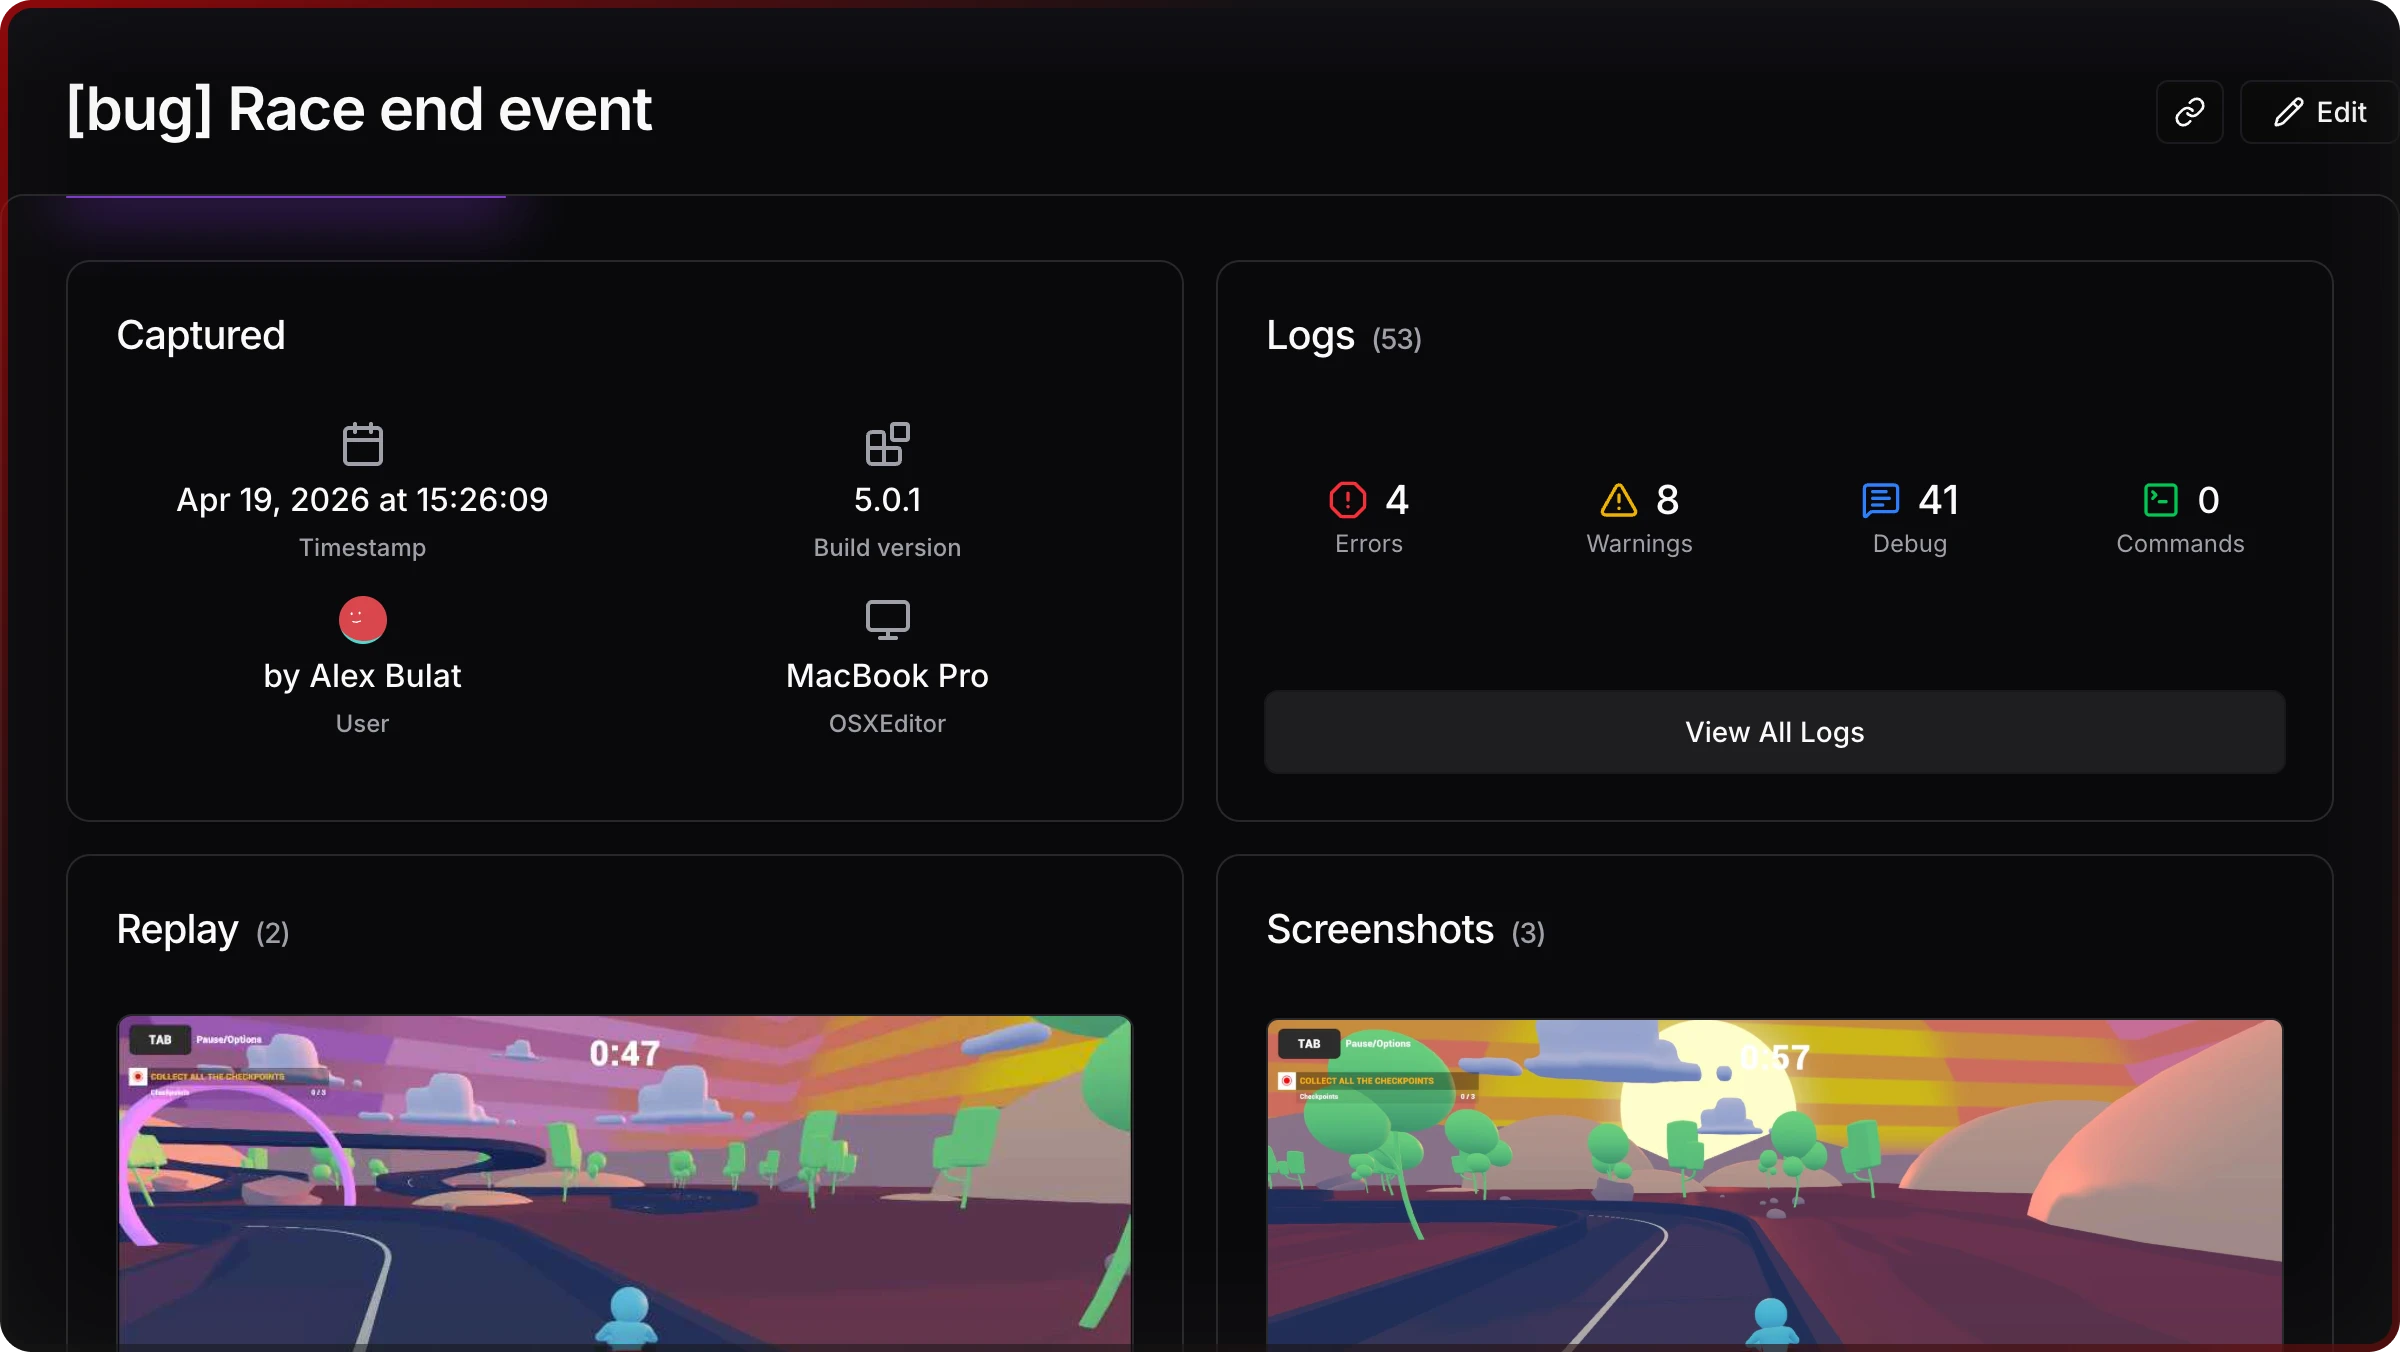
Each session is a complete record: logs, screenshots, and device context in one URL. Team members can open it in a browser without Jahro installed.
Opening sessions
Go to your project dashboard → Snapshot Sessions. Sessions are listed in reverse-chronological order. Each row shows:
- Session name (editable from the Unity-side before upload)
- Who captured it and when
- Platform and device
- Log counters: Debug / Warning / Error / Command / Screenshots
Click any session to open the detail view.
What's inside a session
Each session has two tabs:
- Logs — the full log stream from that capture, with filtering, text search, stacktrace expansion, and per-entry shareable links
- Screenshots — images taken on-demand during the session, with zoom, download, and direct links to specific frames
The session header shows Unity version, OS version, device name, and the team member who captured it. Device context is what makes device-specific bugs reproducible without borrowing the tester's hardware.
Sharing a session
Copy the URL from the address bar or the Copy Link button in the session header. Send it to anyone on your team — no Jahro install needed to view logs and screenshots.
To link to a specific log entry or screenshot, use the copy-link icon inside the Logs Viewer or Screenshots Viewer.
Gotchas
Retention limits apply. Sessions expire based on your plan — 30 days on Solo, 90 days on Team. Expired sessions are deleted permanently. If you need to keep a session long-term, download the logs and screenshots before the retention window closes. See Billing & Quotas for exact limits.
Sessions must be uploaded or streamed to appear here. A session in "Recorded" status on-device hasn't been sent yet. The team member who captured it needs to upload it from the in-game Snapshots tab first.
Frequently asked questions
How do I share Unity debug sessions with my team? Open the session in the web console and copy the URL. Anyone on your team can view the full log history and screenshots in a browser — no Jahro install needed.
Can I link directly to a specific log entry? Yes. In the Logs Viewer, each log entry has a copy-link icon that appends a reference to the session URL. Useful when filing a bug report or pointing a developer to the exact error.
How long are sessions stored? Solo plan: 30 days. Team plan: 90 days. Both windows run from the capture date, not your billing date. See Billing & Quotas for details.
I don't see a session I just captured — why? The session was captured in Recording mode and hasn't been uploaded yet. On-device, open the Jahro console → Snapshots tab → tap Upload on the session. Once uploaded, it appears in the web console within a few seconds.
Related
- Logs Viewer — filter, search, and share individual log entries from a session
- Screenshots Viewer — browse and download images from a session
- Unity Snapshots — how sessions are captured and uploaded from inside Unity
- Team Management — control who has access to your project sessions
- Billing & Quotas — snapshot limits and retention windows by plan